This topic contains a solution. Click here to go to the answer
|
|
|

 Nitrogen fluxes in Sycamore Creek, Arizona (data from Grimm 1988).
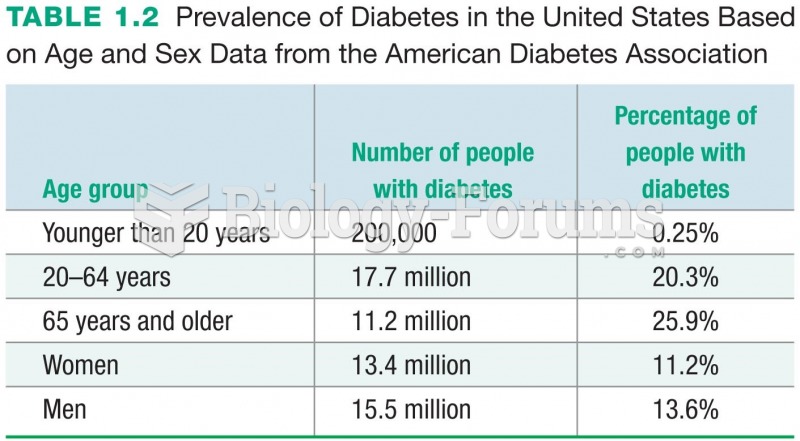 Prevalence of Diabetes in the United States Based on Age and Sex Data from the American Diabetes ...
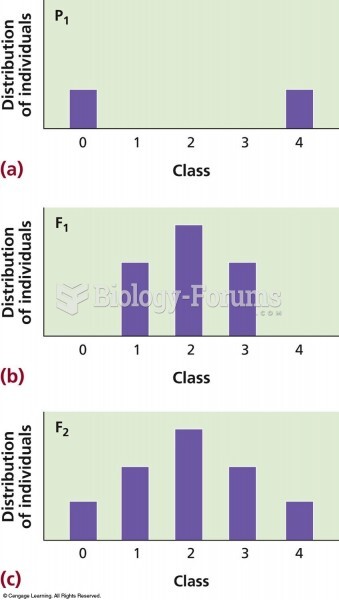 Frequency diagrams of skin colors. (a) Skin color distribution in the parents falls into two discont
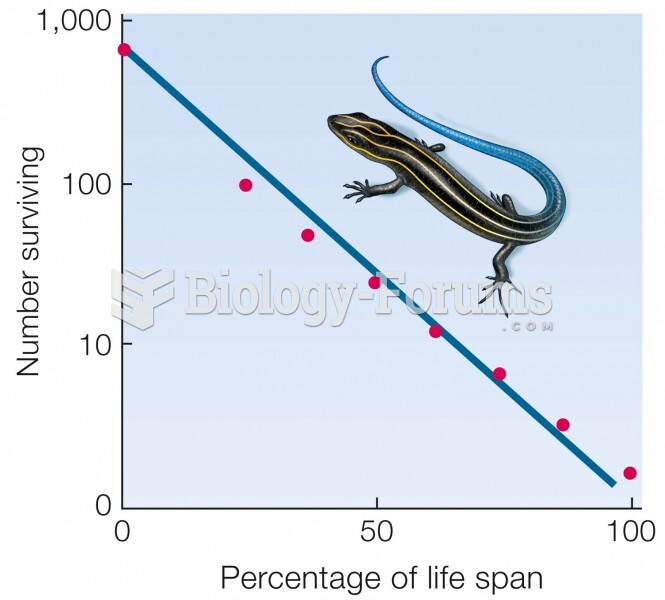 Type II curve. Mortality does not vary with age. Data for five-lined skink (Eumeces fasciatus).
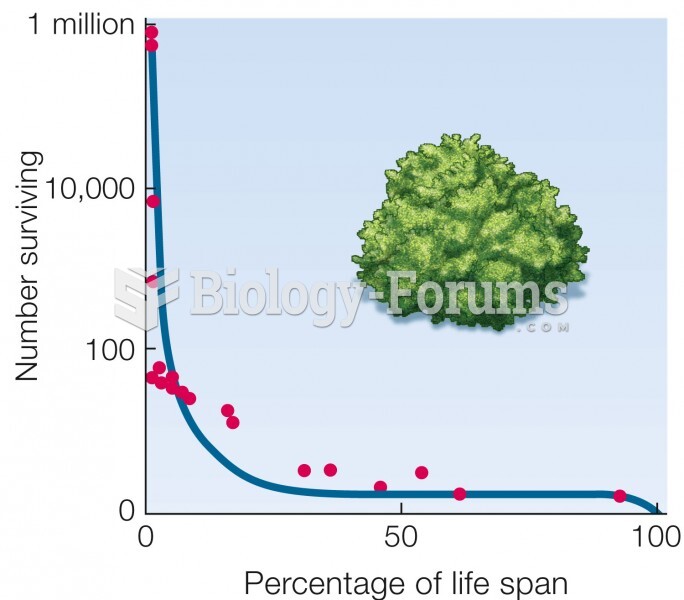 Type III curve. Mortality is highest early in life. Data for a desert shrub (Cleome droserifolia).
 The consequences of the intensity of natural selection on allele frequency.