|
|
|

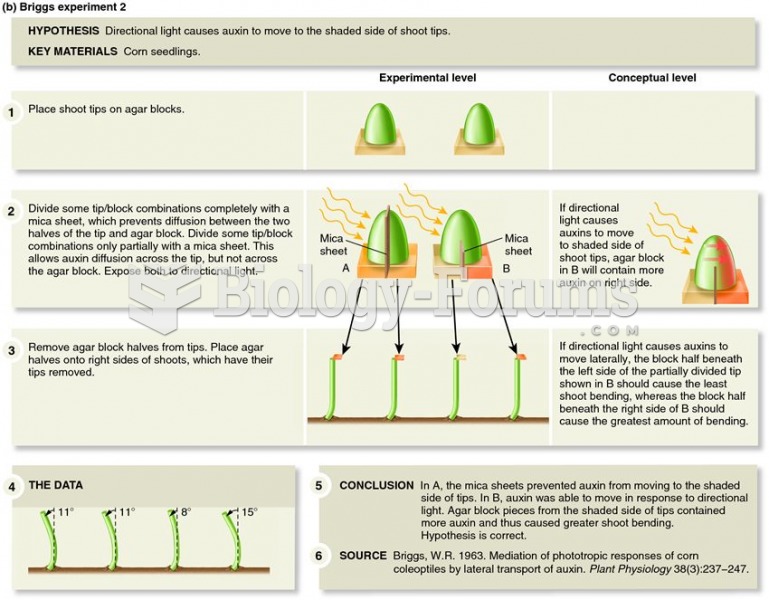 Went and Briggs demonstrated the relationship between light perception and auxin function.
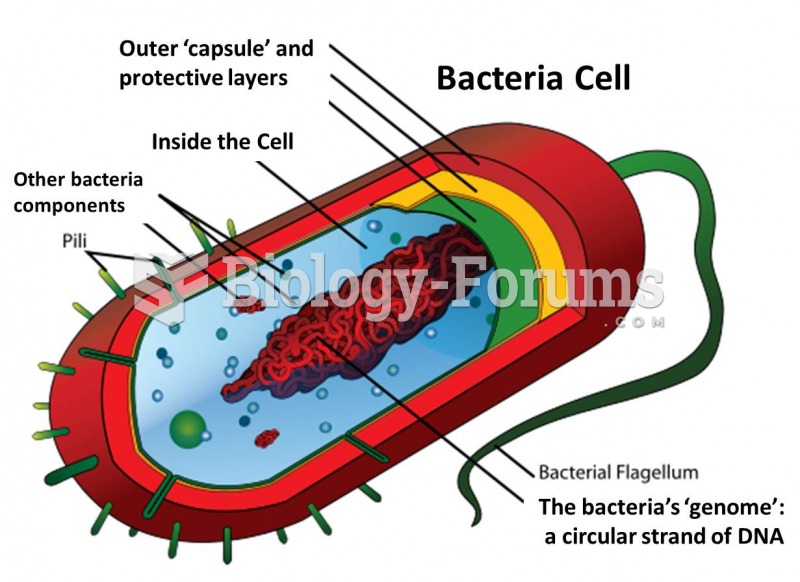 Bacteria Diagram
 Sunset Diagram of changes in East and West from Solstice
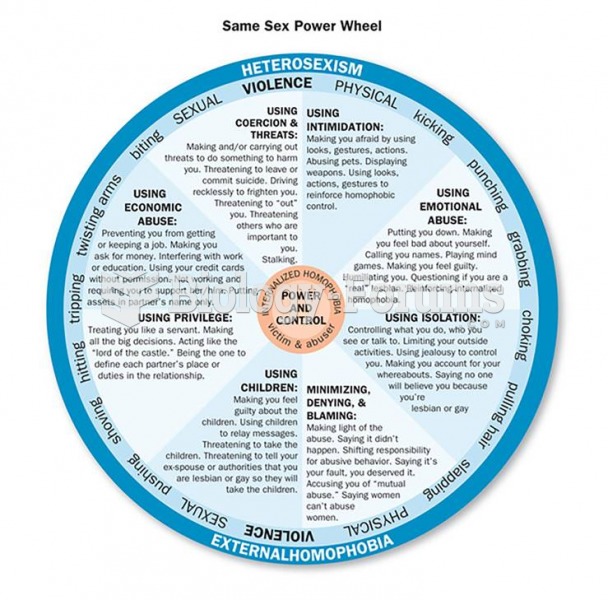 The Power and Control Wheels of Abusive Relationships When one person in a relationship repeatedly ...
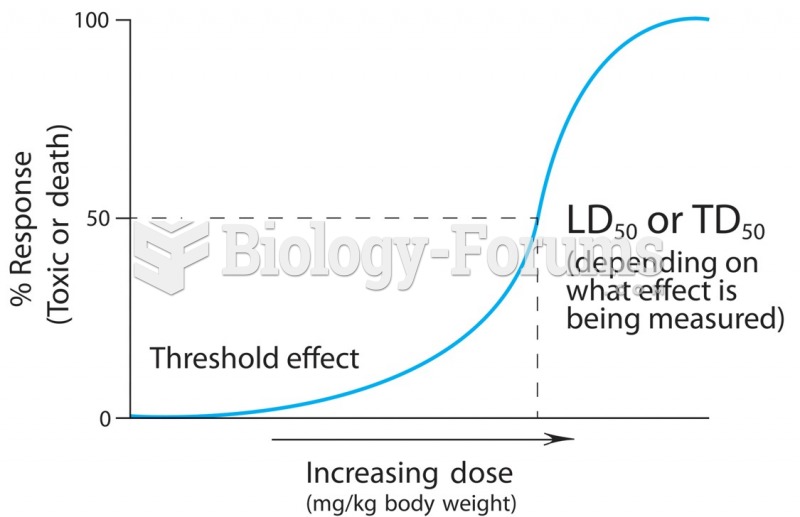 A dose-response curve describes the relationship between the quantity of the chemical entering the ...
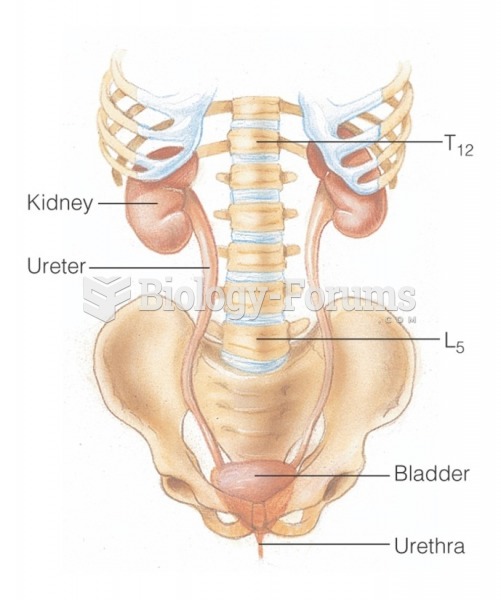 The urinary system: Relationship of the kidneys to the vertebrae