|
|
|

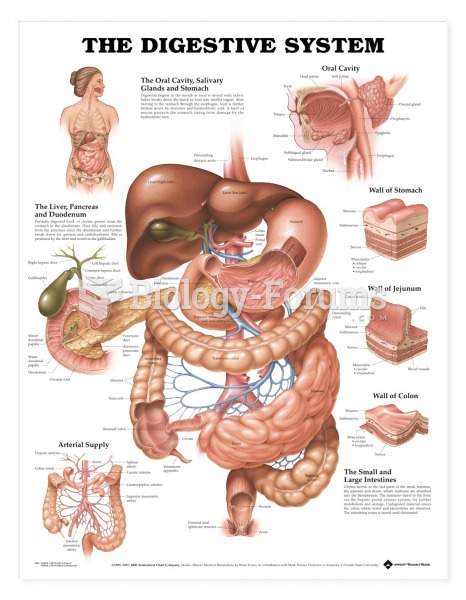 Anatomical Charts Digestive System
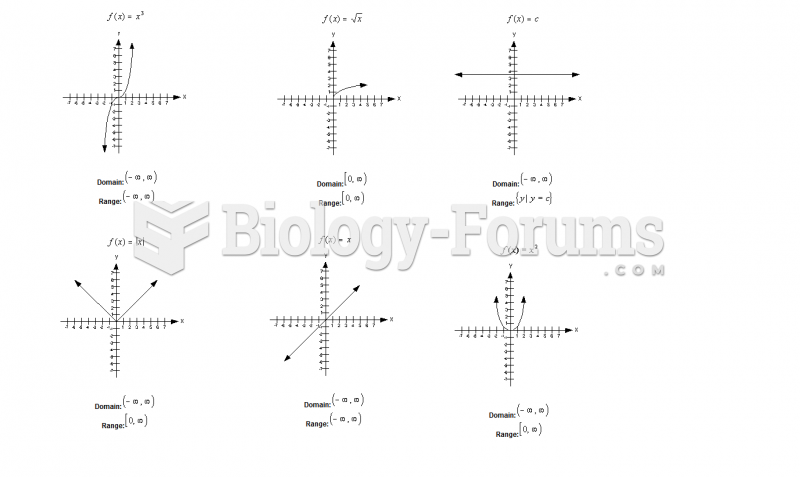 Basic graphs of functions
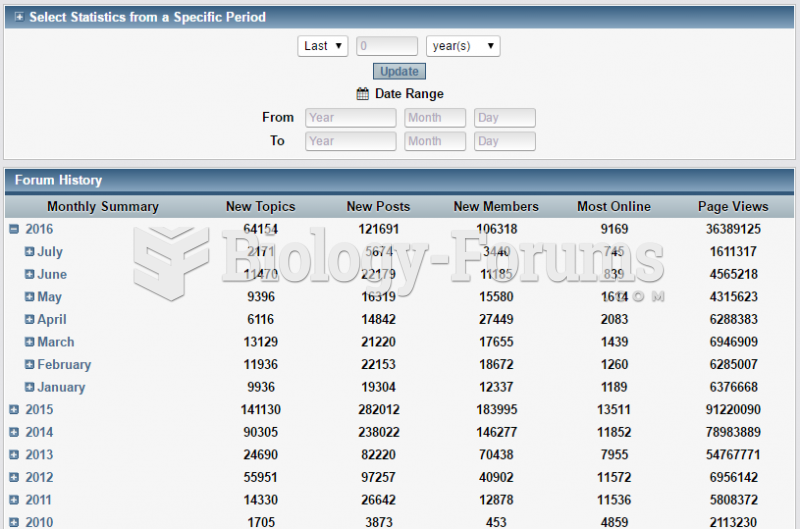 Statistics Center (07/2016)
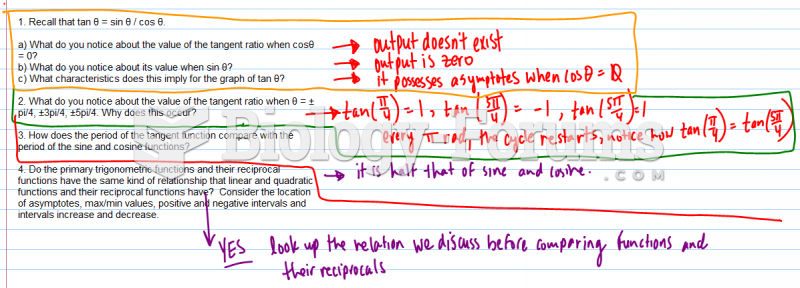 Graphs of Primary Trigonometric Ratios
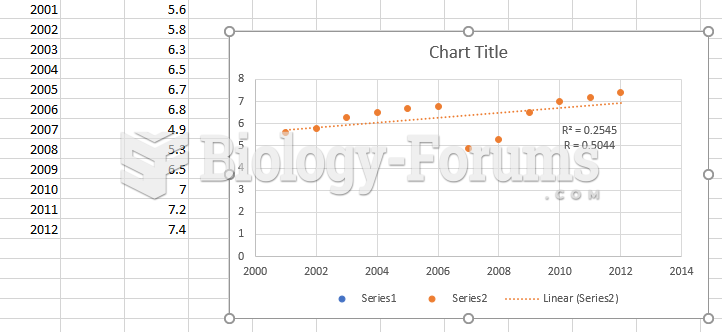 Statistics Question: A swim team
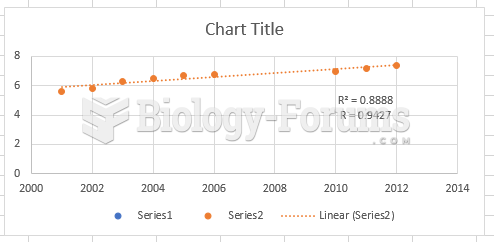 Statistics Question: A swim team
|
|
|
Anatomical Charts Digestive System
Basic graphs of functions
Statistics Center (07/2016)
Graphs of Primary Trigonometric Ratios
Statistics Question: A swim team
Statistics Question: A swim team
For a complete list of videos, visit our video library