|
|
|

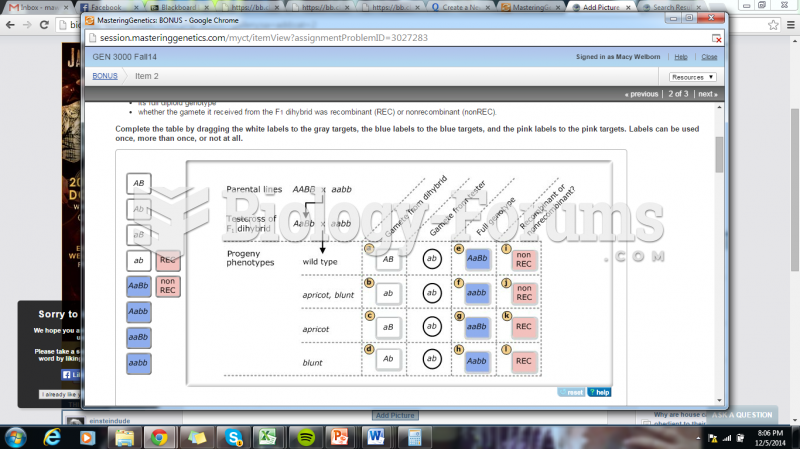 Complete the table by dragging the white labels to the gray targets, the blue la
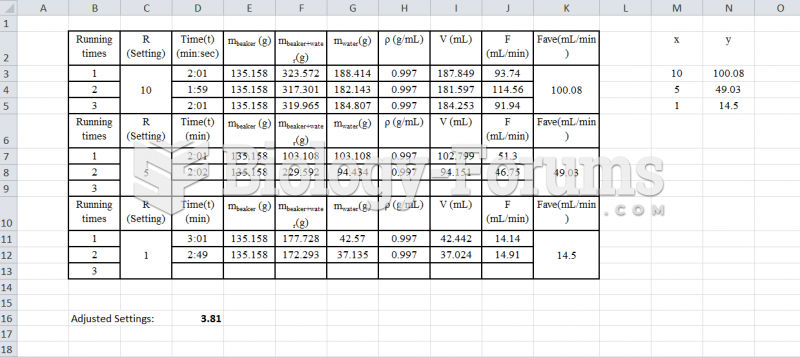 Fluidization - Calibration Table Pump #1
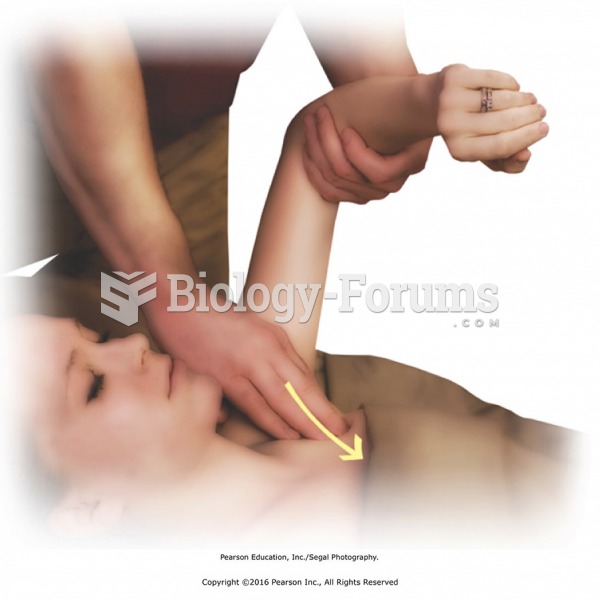 Apply effleurage and direct pressure on attachments of pectoralis minor. Lift one arm off the table ...
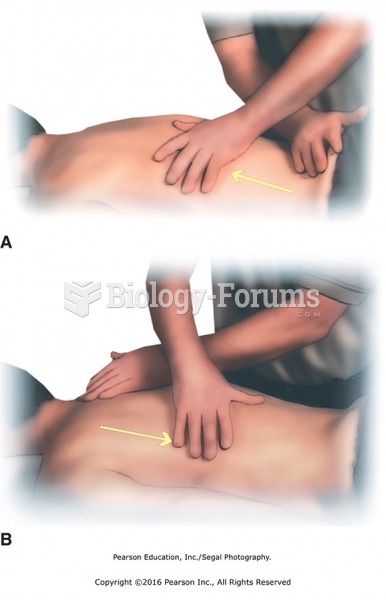 Effleurage hand over hand along spinal muscles. Stand at the side directly facing the table and ...
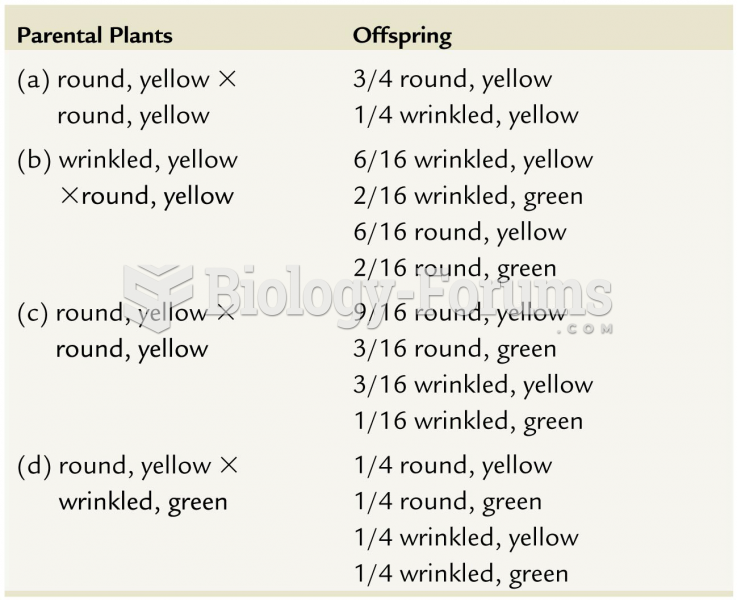 Table showing comparing between Parental Plants vs. Offspring
 table
table