|
|
|

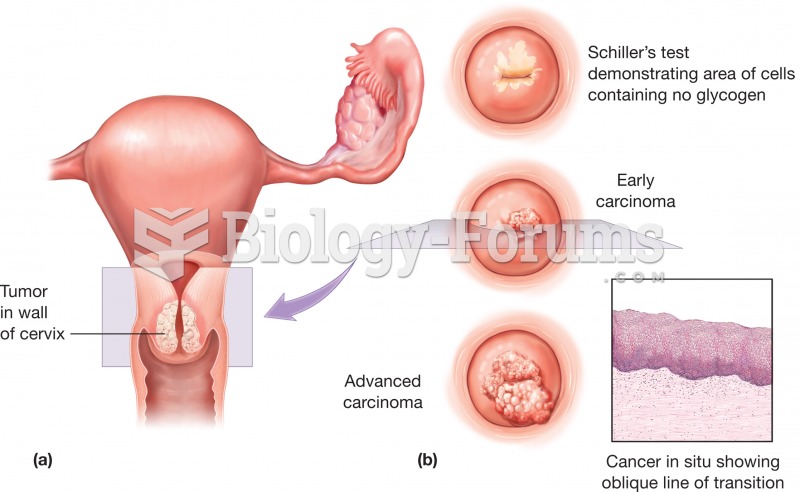 Cervical cancer (a) Top view of the uterus showing the presence of a tumor in the wall of the cervix
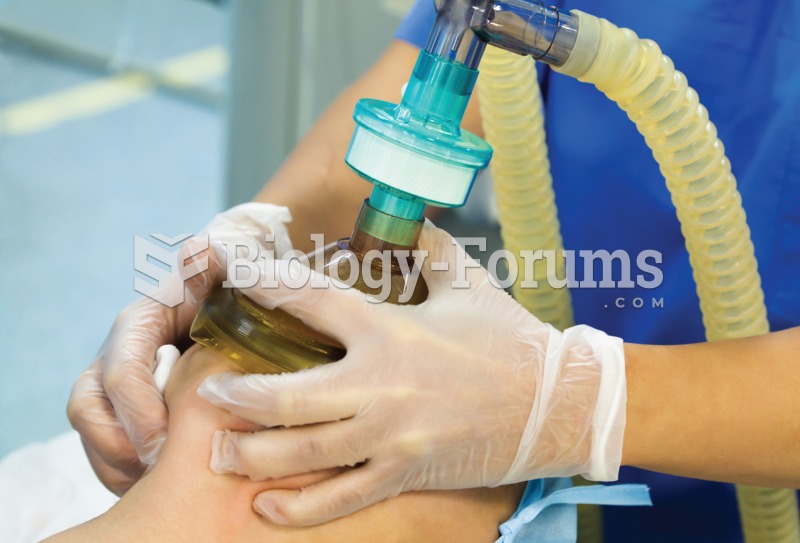 Mechanical ventilation. The photograph shows a patient receiving breathing assistance by the use of
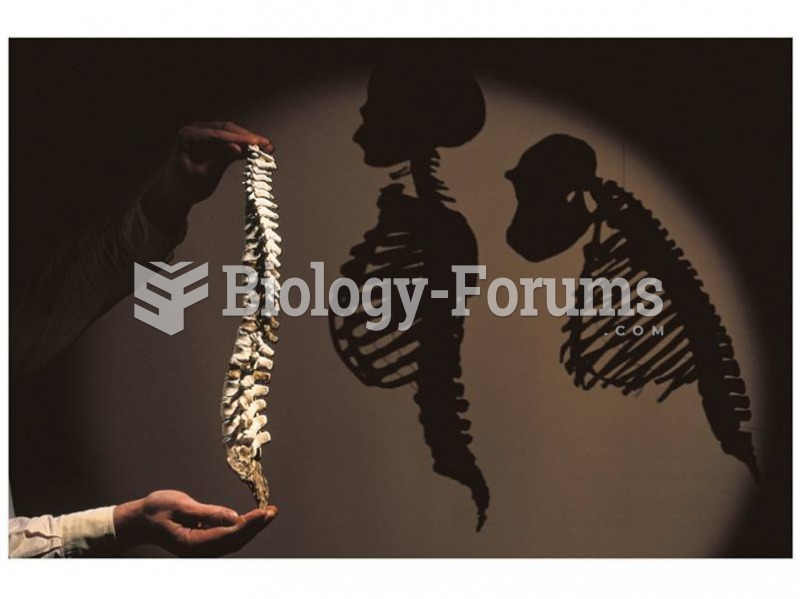 Reconstructed Australopithecus afarensis spine shows that species walked upright.
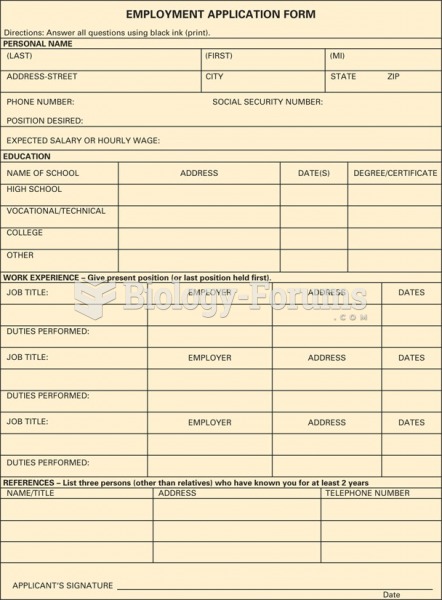 A standard employment application form may be used.
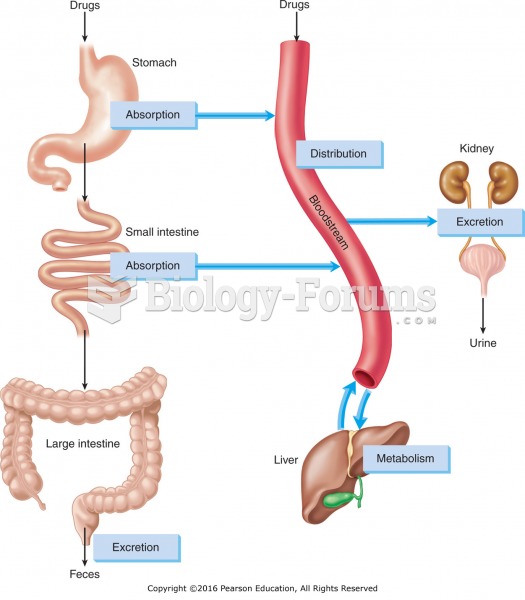 The four processes of pharmacokinetics: absorption, distribution, metabolism, and excretion.
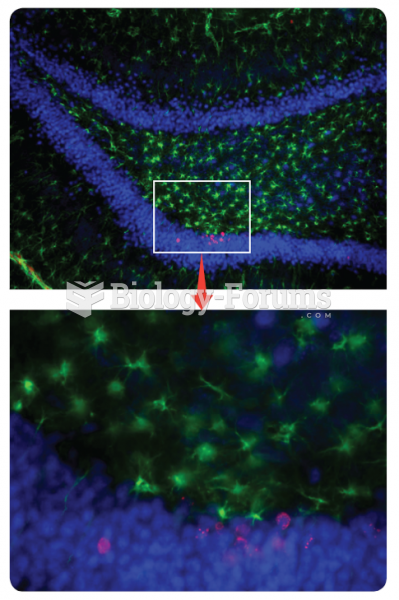 Adult neurogenesis. The top panel shows new cells in the dentate gyrus of the hippocampus—the cell ...