|
|
|

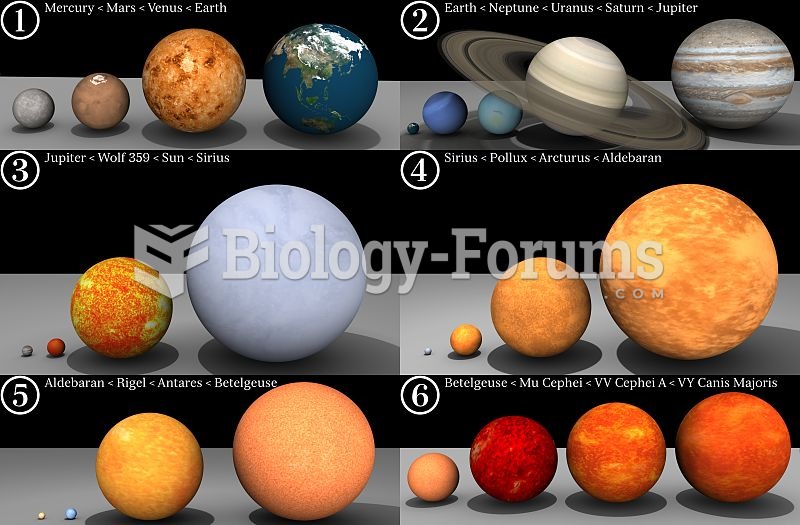 Stars vary widely in size.
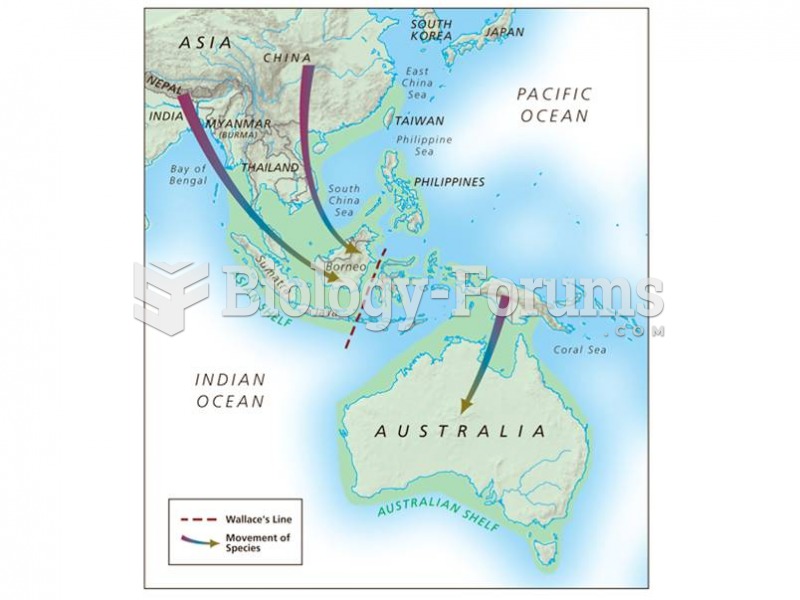 Landbridge connections between continental Asia and Indonesia during glacial periods extend as far a
 Line analysis of Titian, Assumption and Consecration of the Virgin.
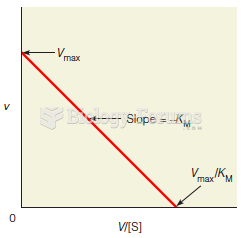 An Eadie–Hofstee plot
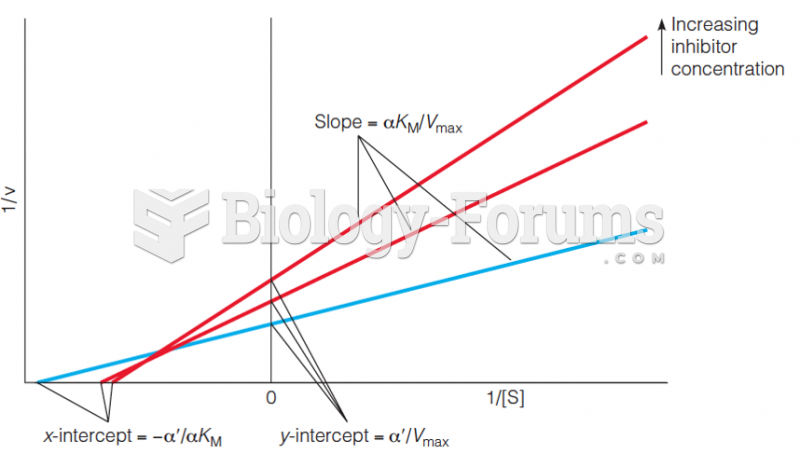 Lineweaver–Burk plot for mixed inhibition kinetics
 An inventory record sheet shows a balance on hand of 972. During the month units sold were 111, ...