|
|
|

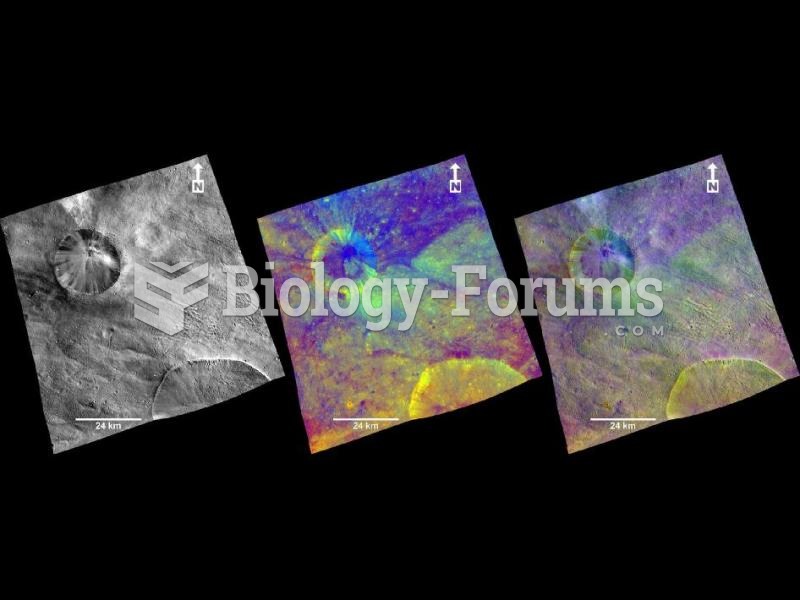 Aquilia Area in Color:
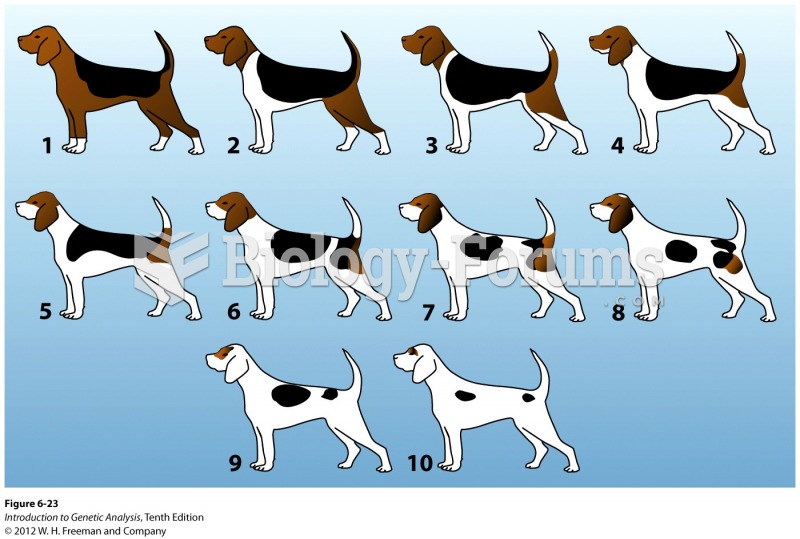 Variable expressivity
 Axis (C2)
 How Axis Tilt Affects the Intensity of Solar Radiation
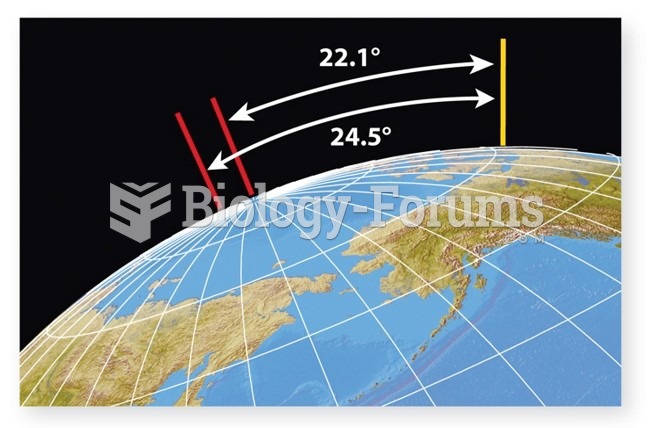 Obliquity "Tilt of Earth on its axis"
 Skin color is a polygenic trait controlled by three or four genes, producing a wide range of phenoty