This topic contains a solution. Click here to go to the answer
|
|
|

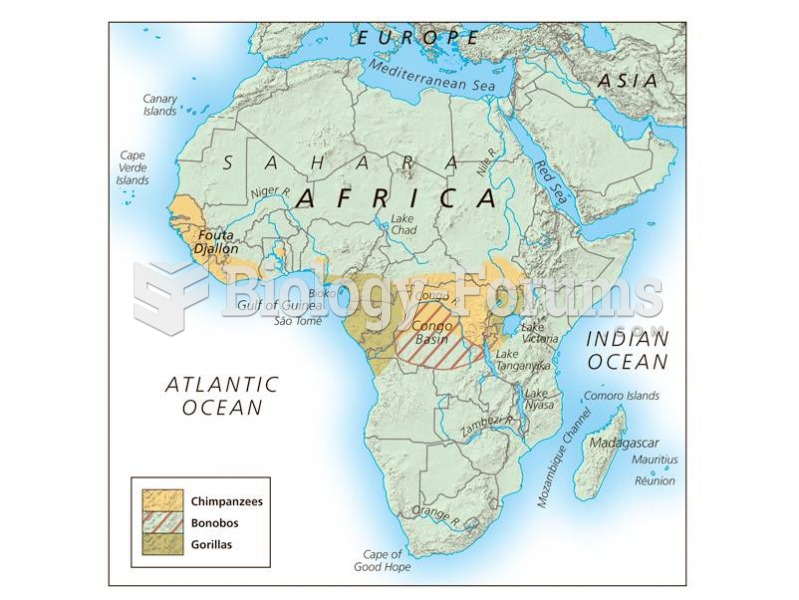 Distribution of the African great apes.
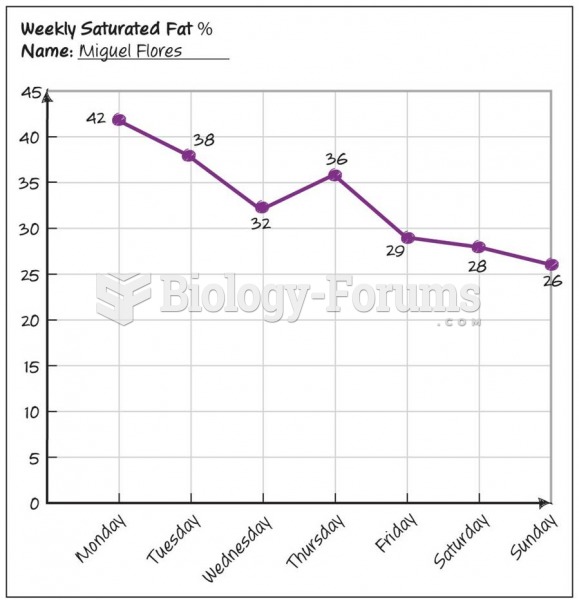 Progression Graph
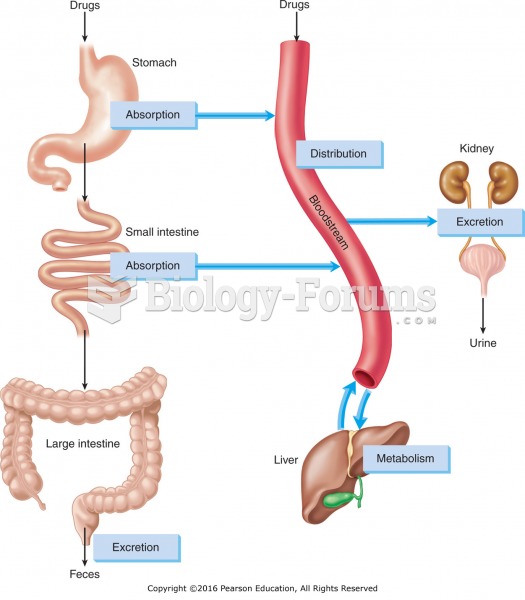 The four processes of pharmacokinetics: absorption, distribution, metabolism, and excretion.
 Velocity-time Graph
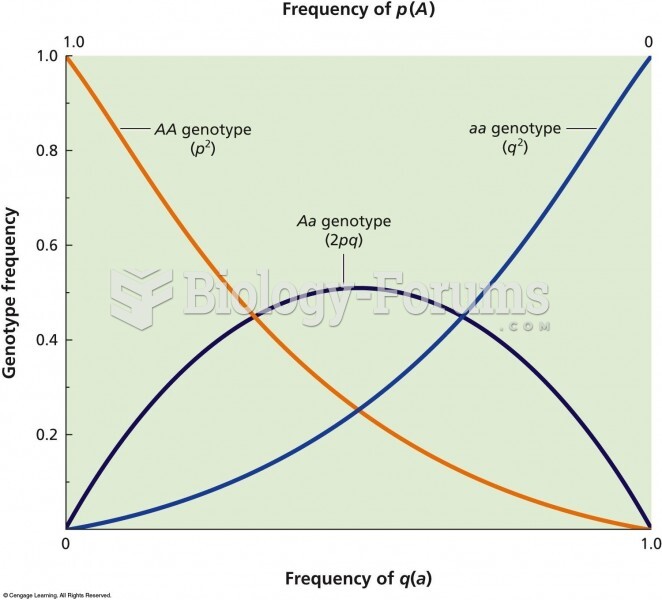 The relationship between allelic frequency and genotypic frequency in a population that is in Hardy-
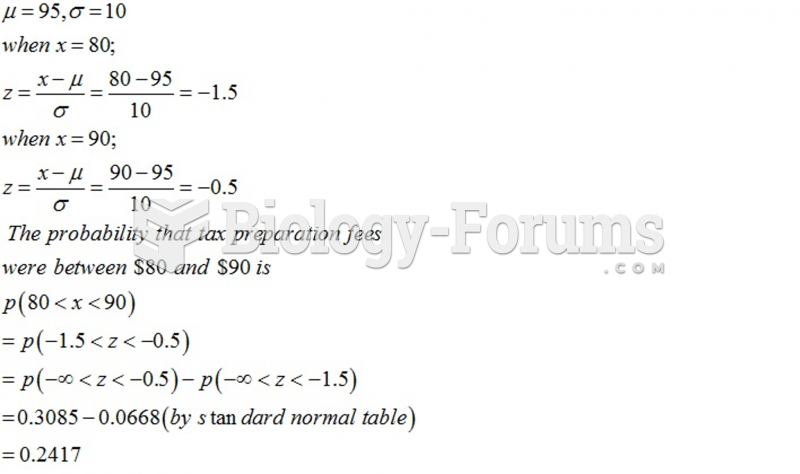 In 2000, the average charge of tax preparation was 95 . Assuming a normal distribution and a ...