|
|
|

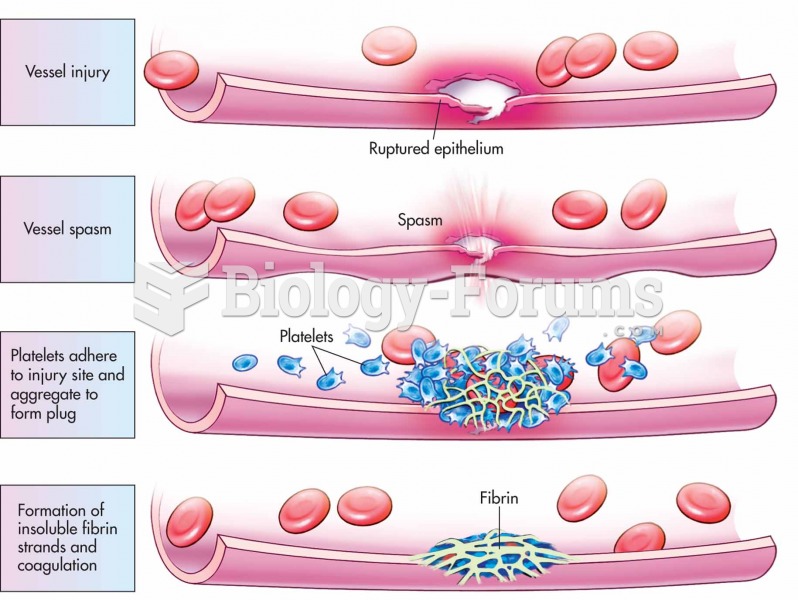 Basic steps in hemostasis.
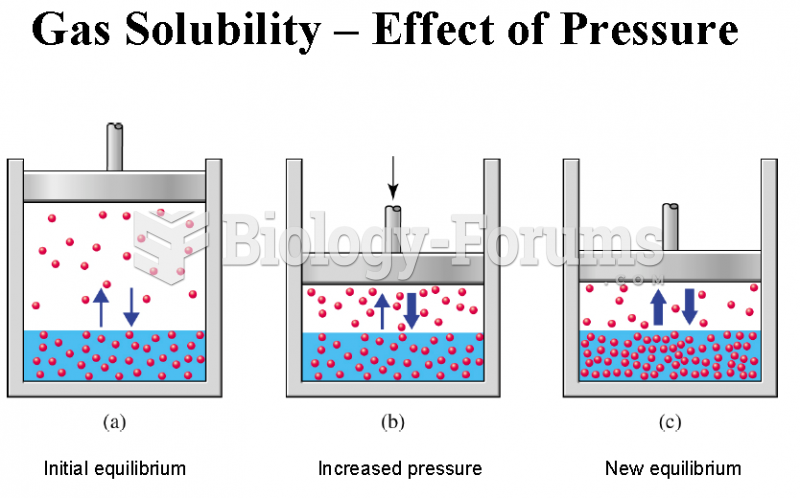 Gas Solubility - Effect of pressure
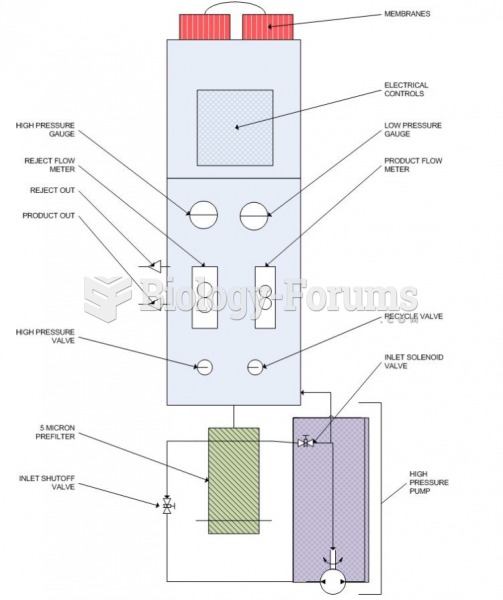 Reverse Osmosis Schematic Diagram
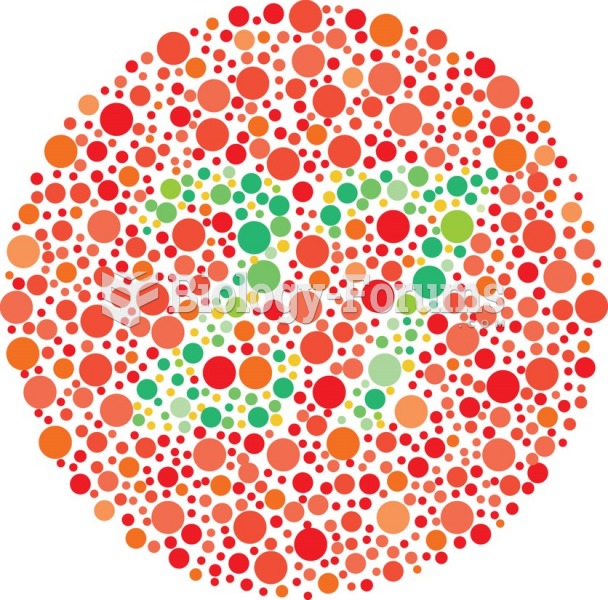 One page of color vision chart.
 The fact that a mother works outside the home has no negative effect on the well-being of her child ...
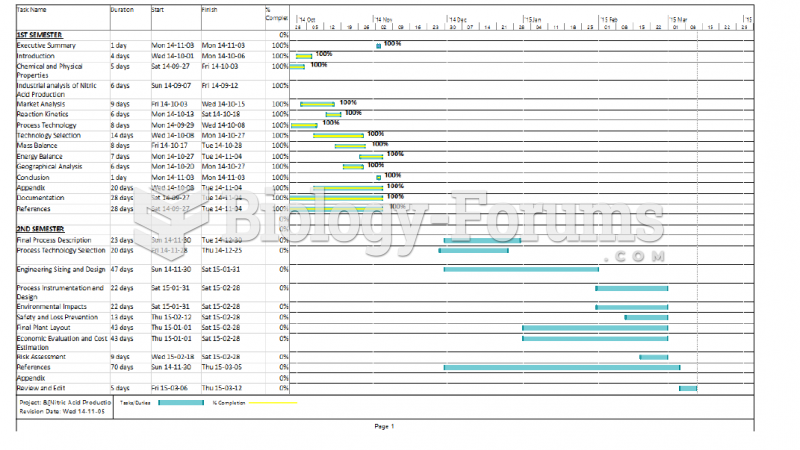 Gantt Chart