|
|
|

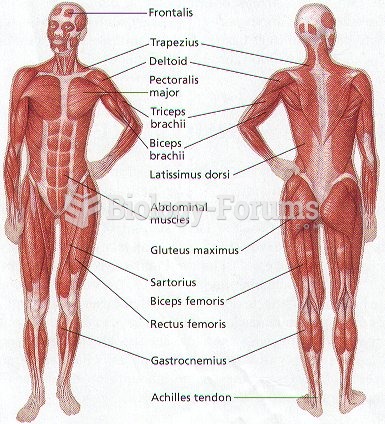 Human Body Muscle Diagram
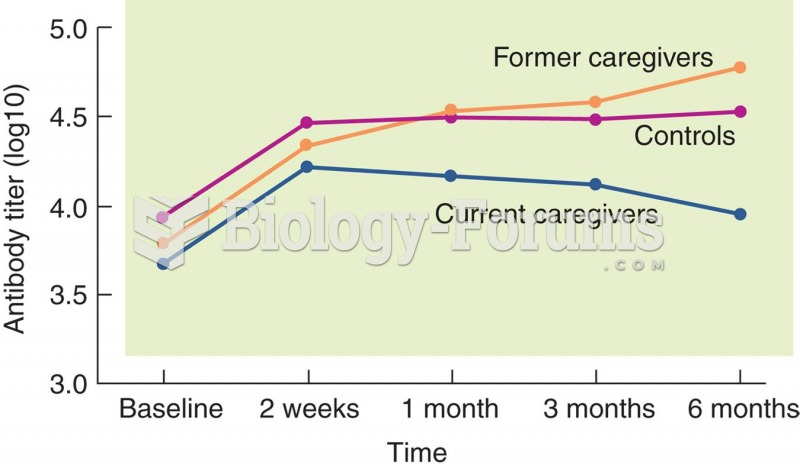 Effect of Stress on Immune Function
 Schematic Diagram of Steam-to-air experiment (CHE415 Unit Operations)
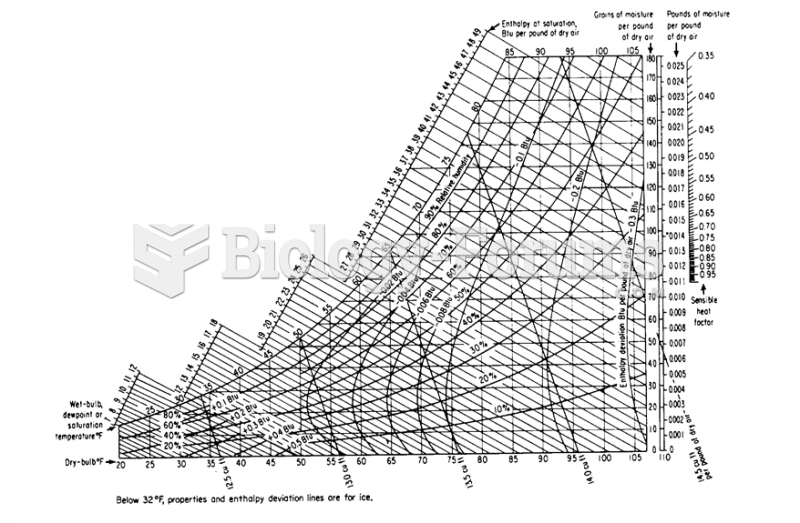 Humidity Chart
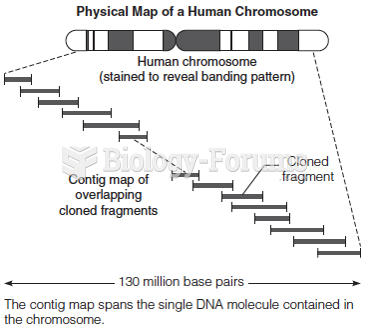 Sequencing a large chromosome by individual sequence determination of cloned fragments in sequences
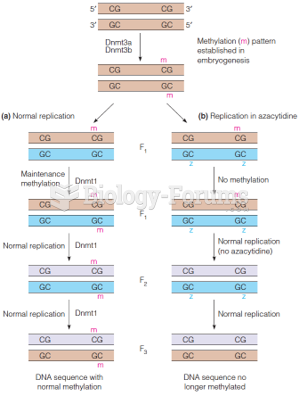 De novo and maintenance methylation of DNA and the effect of 5’-azacytidine upon DNA methylation