|
|
|

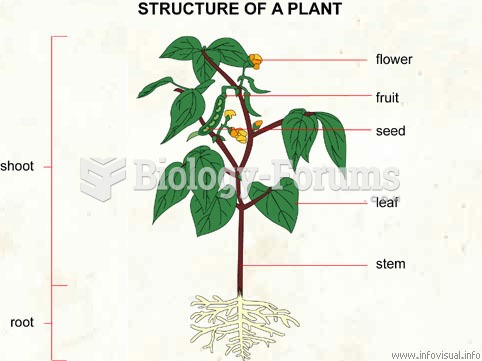 Plant Diagram
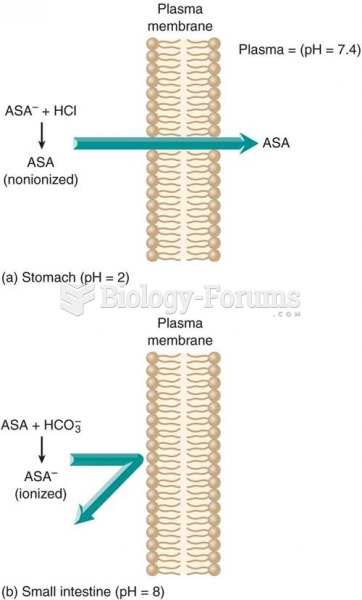 Effect of pH on drug absorption: (a) a weak acid such as aspirin (ASA) is in a nonionized form in an
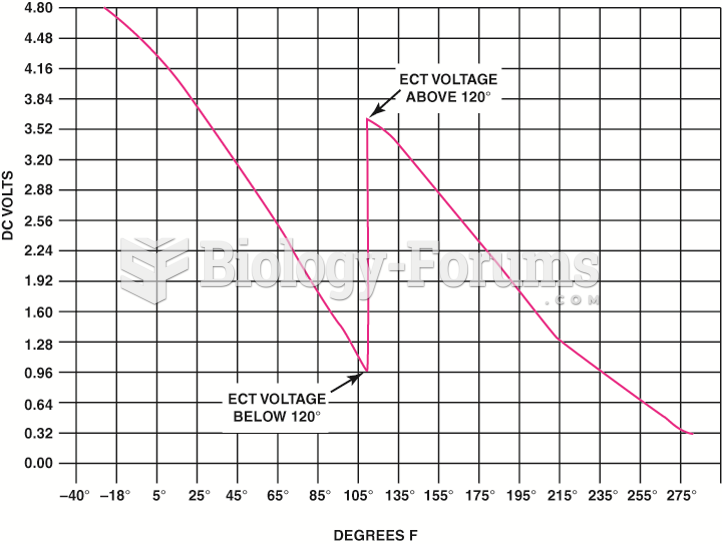 The transition between steps usually occurs at a temperature that would not interfere with cold ...
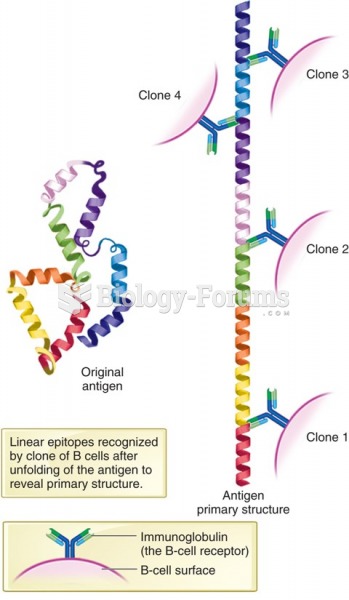 Schematic diagram showing polyclonal response by B cells against linear epitopes.
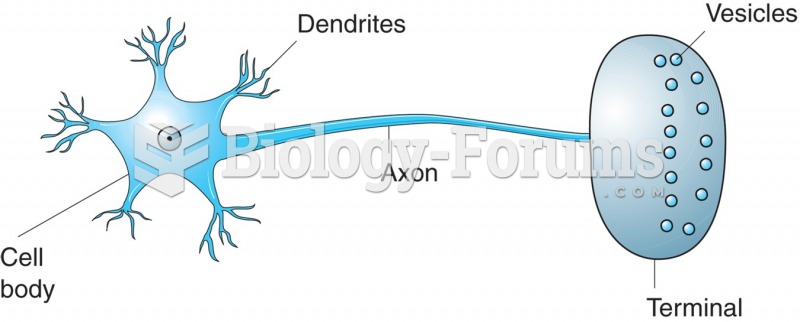 Diagram of a neuron.
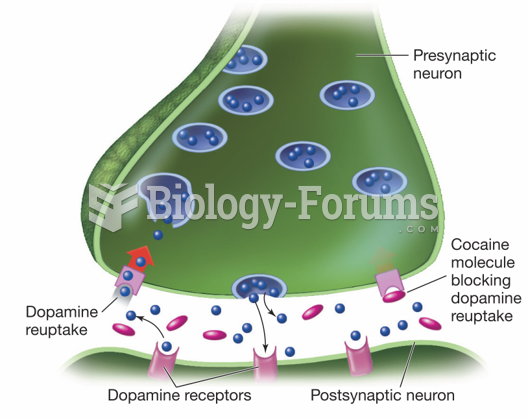 Cocaine’s Effect on the Brain