|
|
|

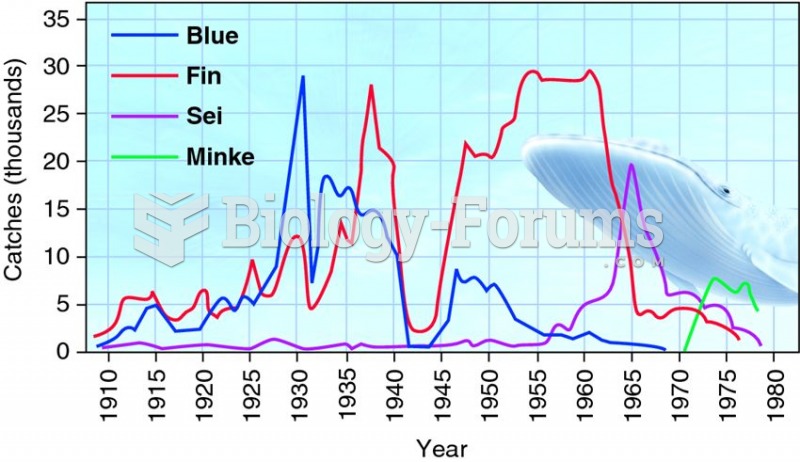 Sequential decline of whale catches in the Antarctic shows the strong effect of human predators.
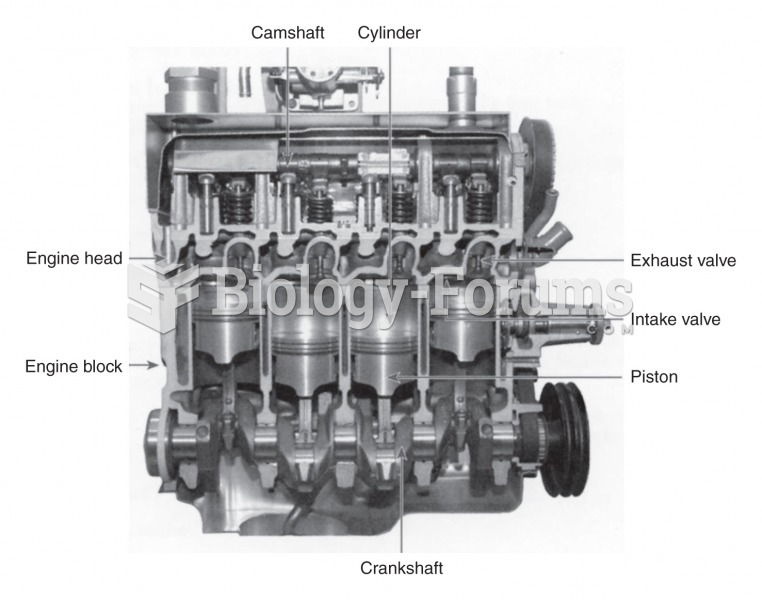 Cutaway diagram of a four cylinder gasoline engine
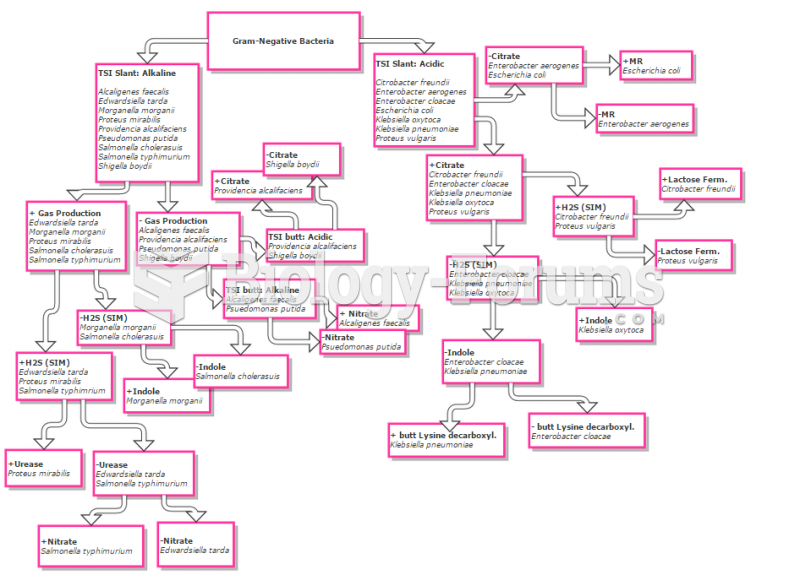 Gram negative flowchart
 Effect of clinical decison support systems
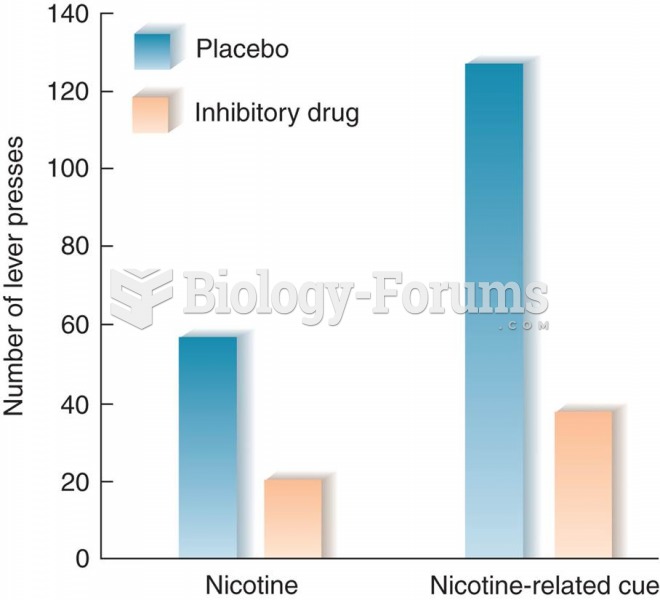 Effect of Inactivation of the Insula on Reinstatement of Drug-Seeking Behavior in Rats
 plant diagram