|
|
|

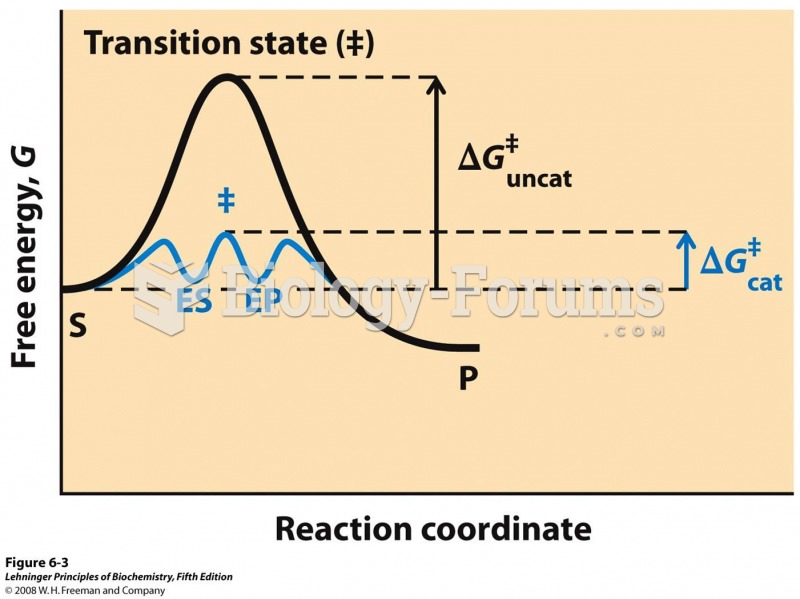 Reaction coordinate diagram comparing enzyme-catalyzed and uncatalyzed reactions
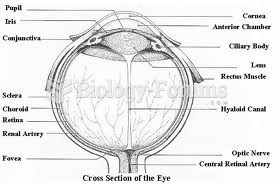 Human Eye Diagram
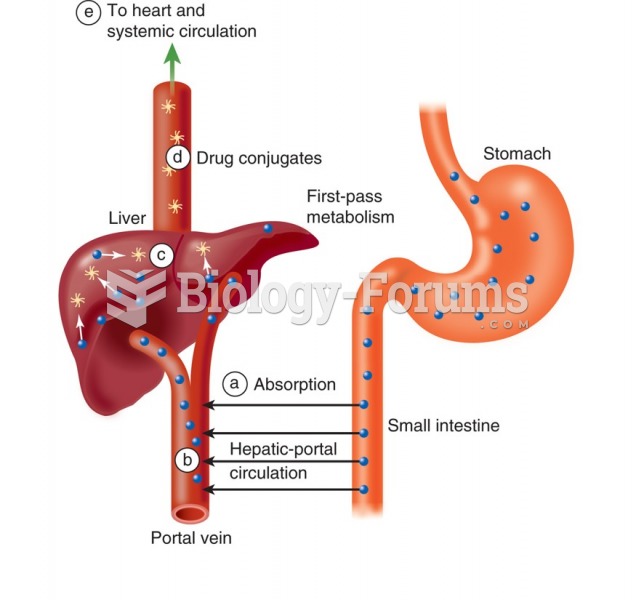 First-pass effect.
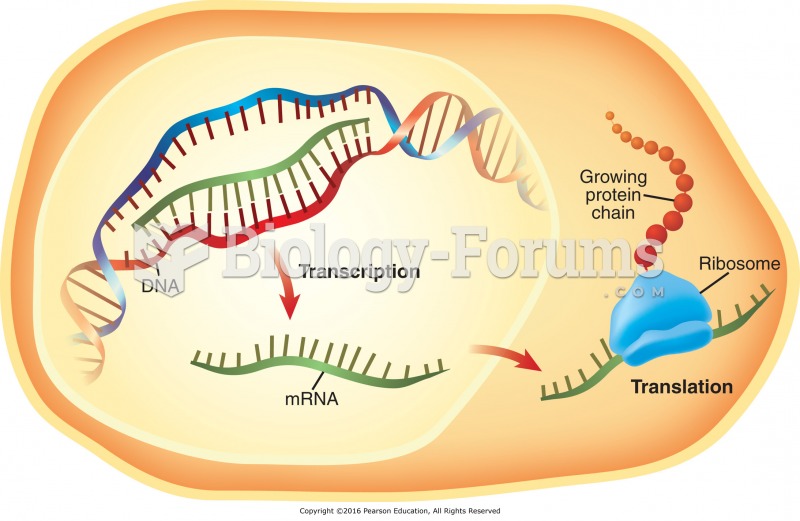 Steps in protein synthesis: The DNA is used as a template to make mRNA (transcription). The mRNA is ...
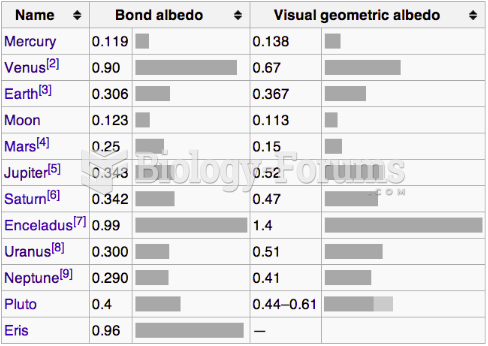 Albedo Chart
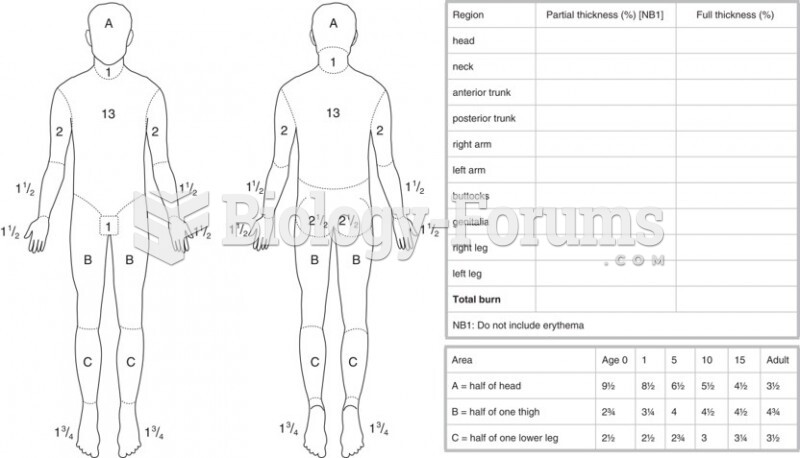 The Lund and Browder Chart