|
|
|

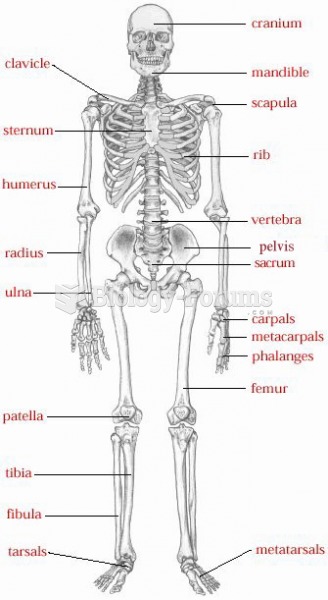 Skeleton Diagram
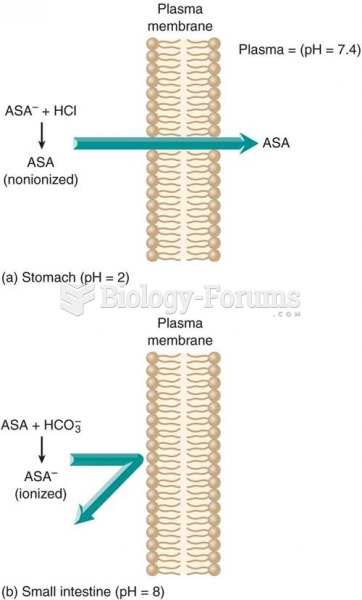 Effect of pH on drug absorption: (a) a weak acid such as aspirin (ASA) is in a nonionized form in an
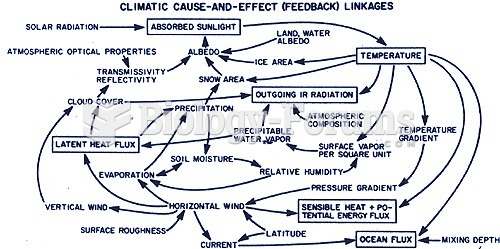 Climatic cause and effect linkages
 Kitagawa Utamaro, Utamaro's Studio, Eshi . . . dosa-hiki (the three primary steps in producing ...
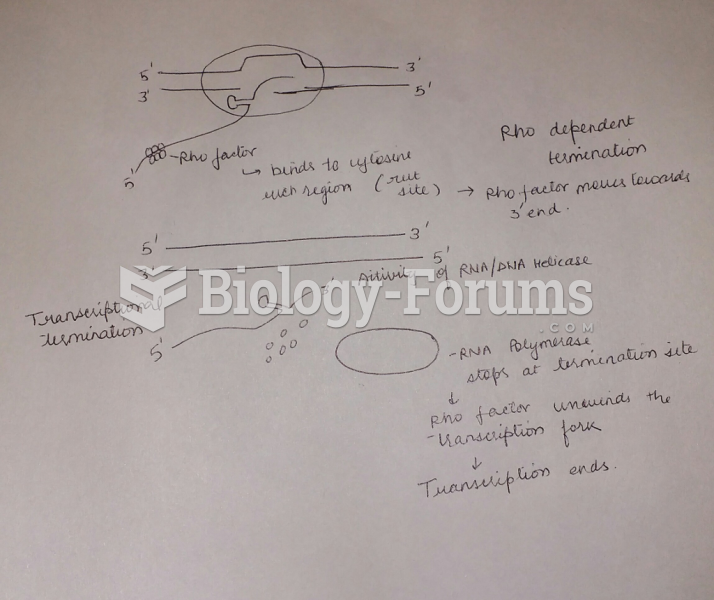 Draw and label a diagram and explain how a factor-dependent transcription (rho-dependent) terminator
 E chart for testing distant vision