|
|
|

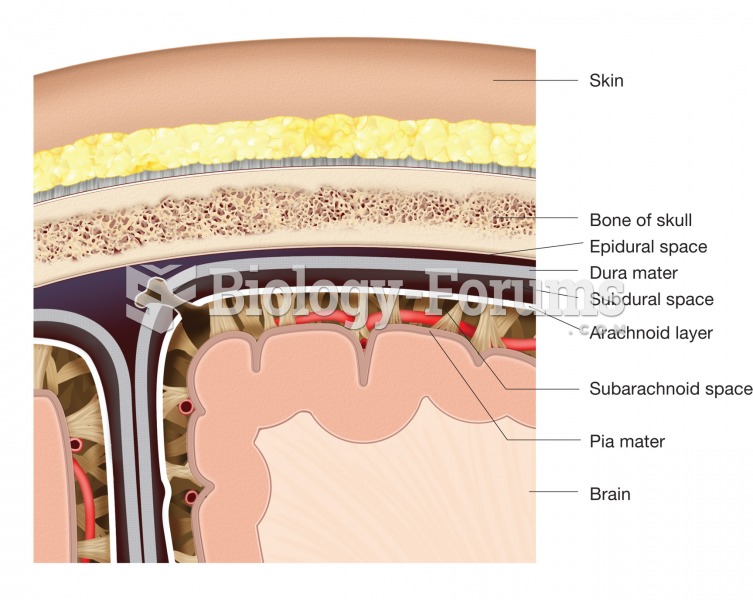 The meninges. This figure illustrates the location and structure of each layer of the meninges and t
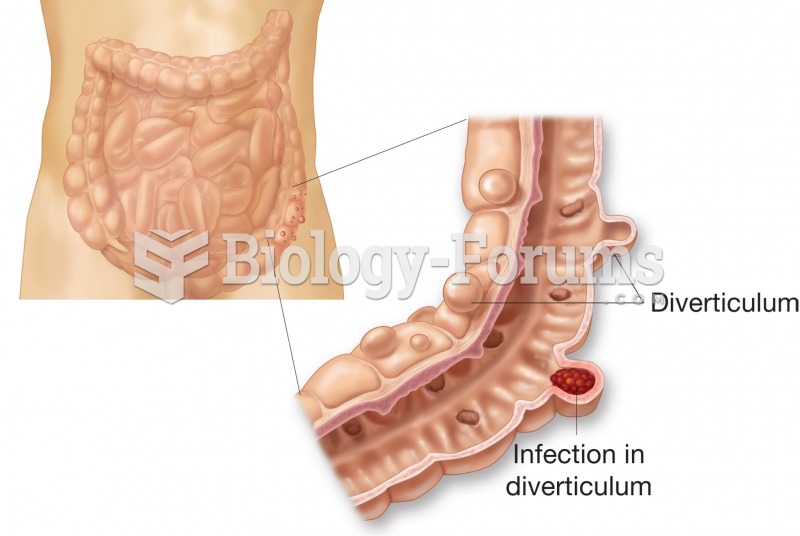 Diverticulosis. Figure illustrates external and internal appearance of diverticula.
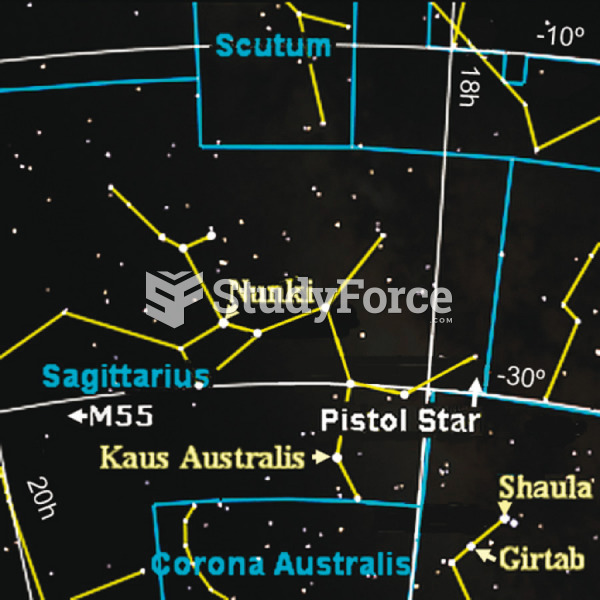 Mass Loss from a Supermassive Star
 Ugonachomma display figure, Igbo, Nigeria.
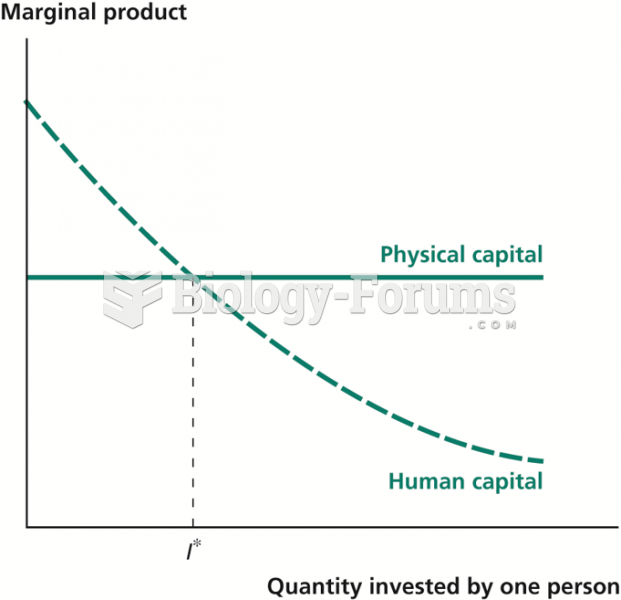 Marginal Products of Physical and Human Capital
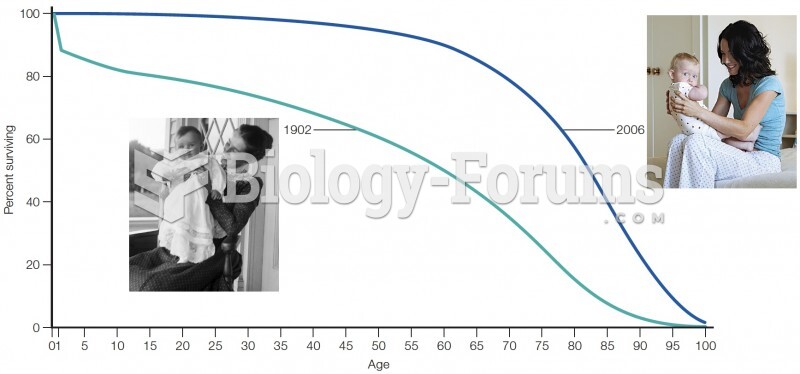 Survivorship curves for people in the United States in the early 20th and early 21st centuries