|
|
|

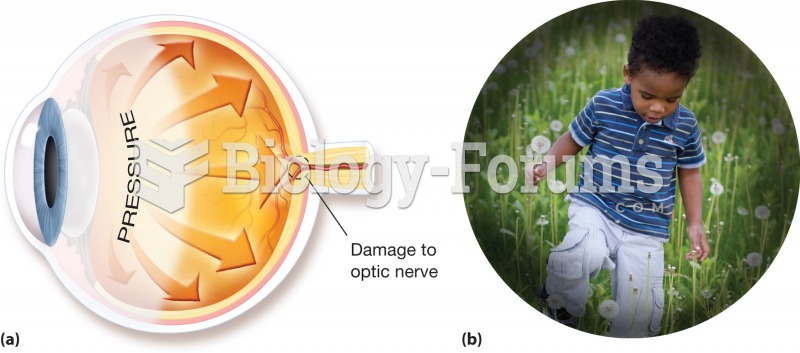 Glaucoma. (a) A buildup of pressure within the eye cavities, often caused by a blockage of vessels t
 Monopoly, patented in 1935, was an instant best-seller: Players risk all their assets in an attempt
 Cost Savings with an EHR System
 Figure of a Woman with a Drawing Showing Evidence of Original Painting and Outlining Design Scheme
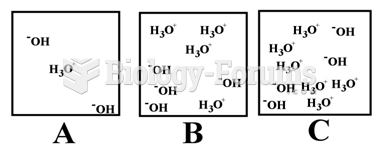 Which of the above illustrations shows an acidic aqueous solution
 An inventory record sheet shows a balance on hand of 972. During the month units sold were 111, ...