|
|
|

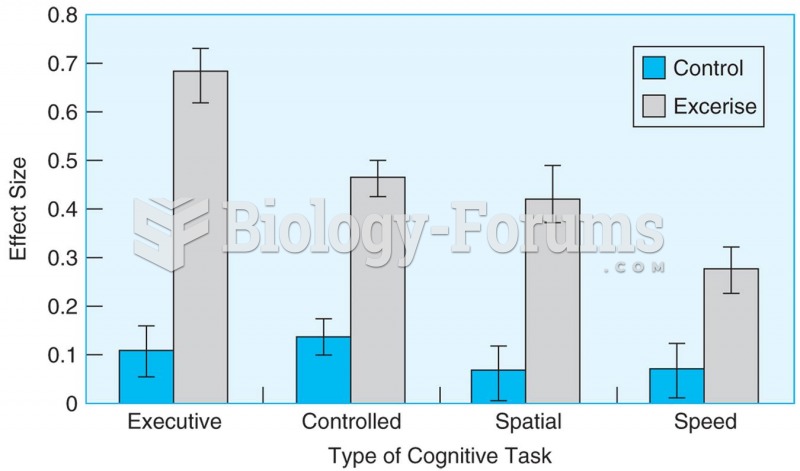 Meta-analysis of 18 studies shows that aerobic exercise causes better performance in older adults on
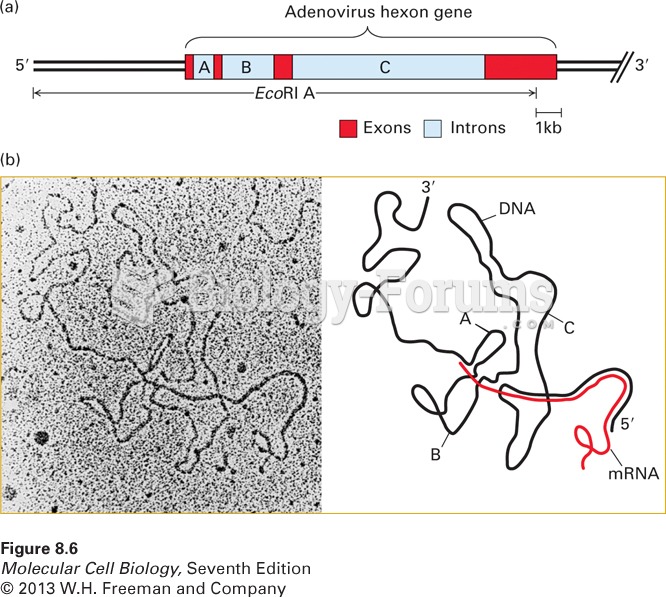 Electron microscopy of mRNA-template DNA hybrids shows that introns are spliced
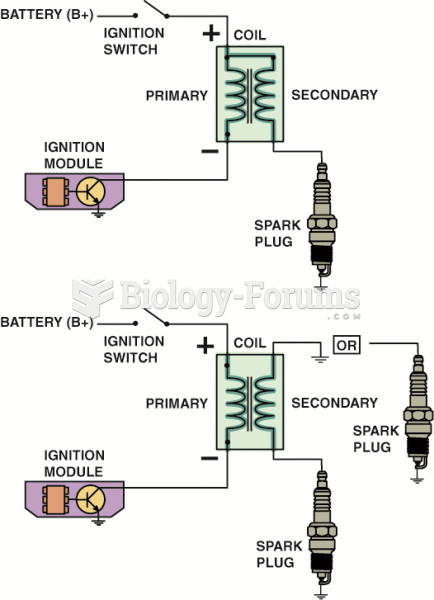 Some ignition coils are electrically connected, called married (top figure), whereas others use ...
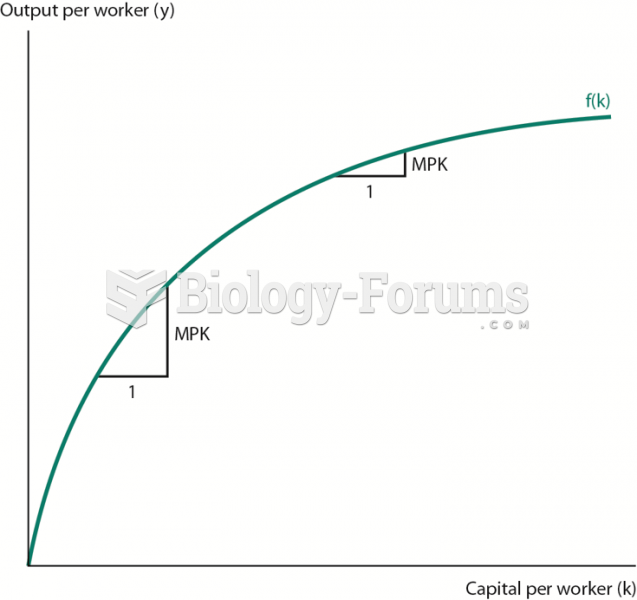 A Production Function with Diminishing Marginal Product of Capital
 A cowbird with its foster parent. A female cowbird minimizes her cost of parental care by laying her
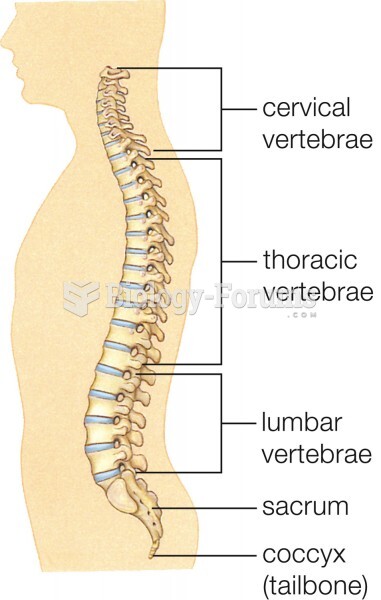 Major bone (tan) and cartilage (light blue) elements of the human skeleton. Inset shows regions of v