|
|
|

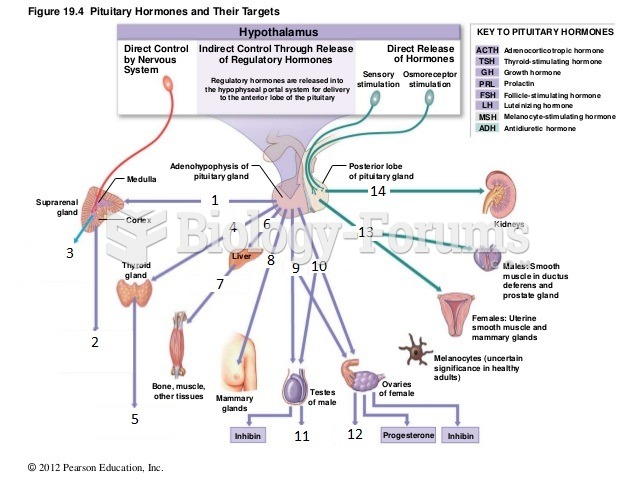 figure 18-1 pituitary hormones
 Cost of Laptops
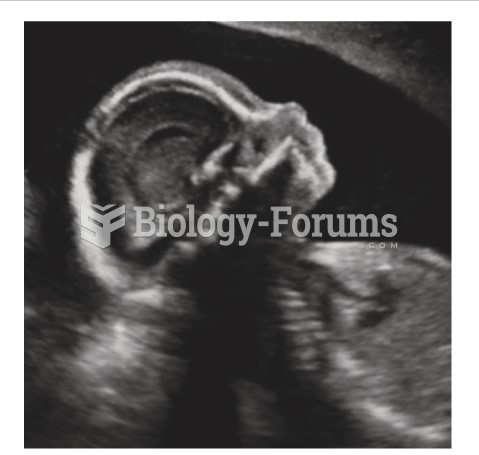 This image shows a normal third-trimester fetal brain
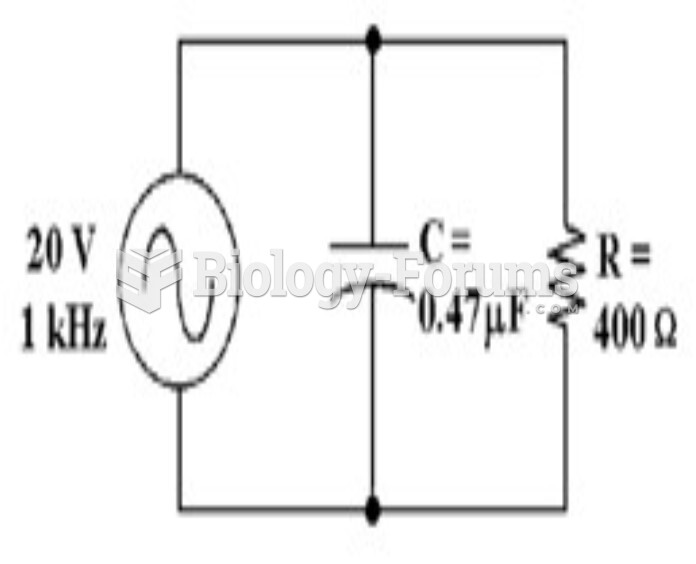 How much voltage does the resistor drop in Figure 10-2? a. 59 mV b. 19.94 V c. 20 V d. 10 V
 Cut the figure into two identical parts
 Swimming Pool (Figure 3.1)