|
|
|

 Mass Loss from a Supermassive Star
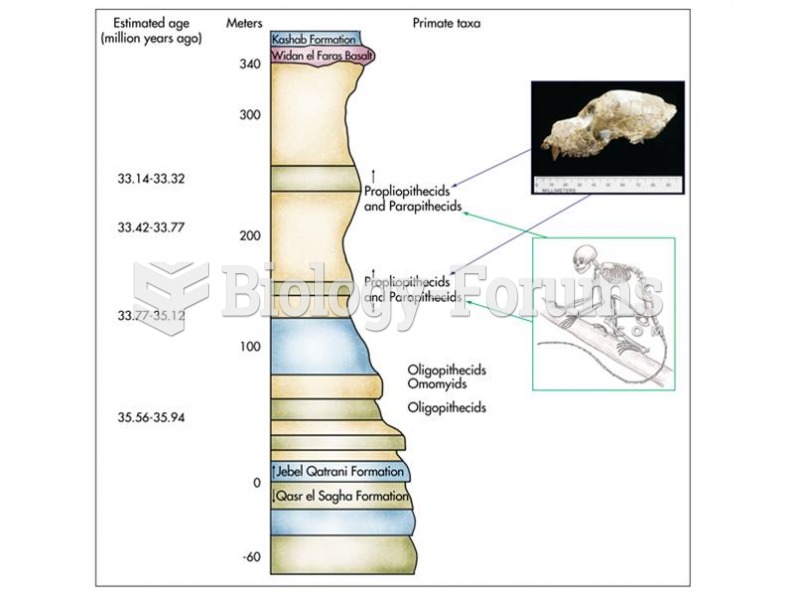 Stratigraphic section of the Fayum shows the relative age of early anthropoid fossils.
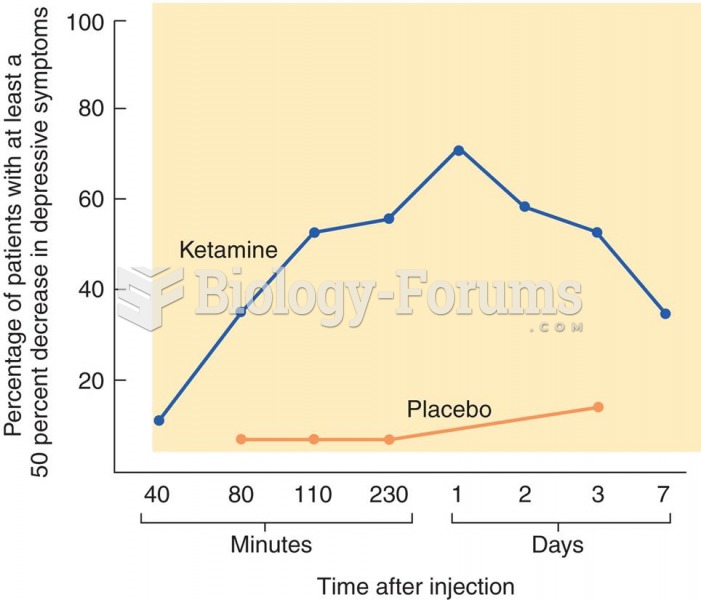 Treatment of Depression with Ketamine The graph shows the effects of ketamine on symptoms of depress
 Increased neurogenesis in the dentate gyrus following damage. The left panel shows (1) an ...
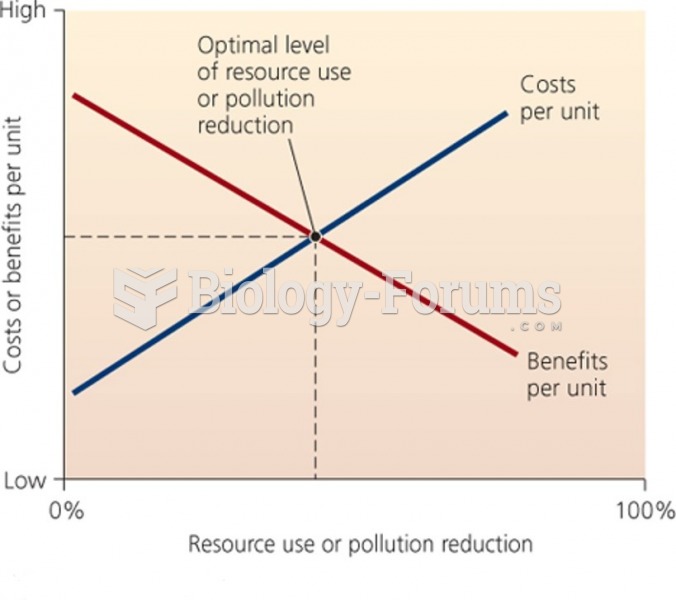 Marginal Supply - Demand Curve
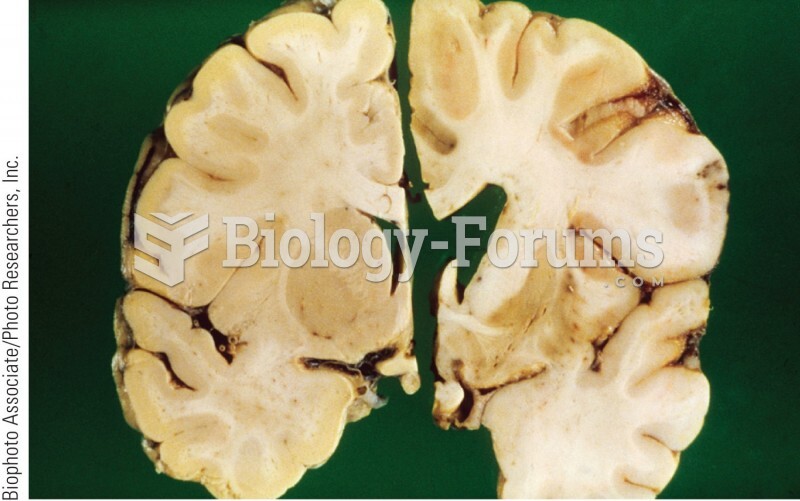 Section of a normal brain (left) and an HD brain (right). The HD brain shows extensive damage to the