|
|
|

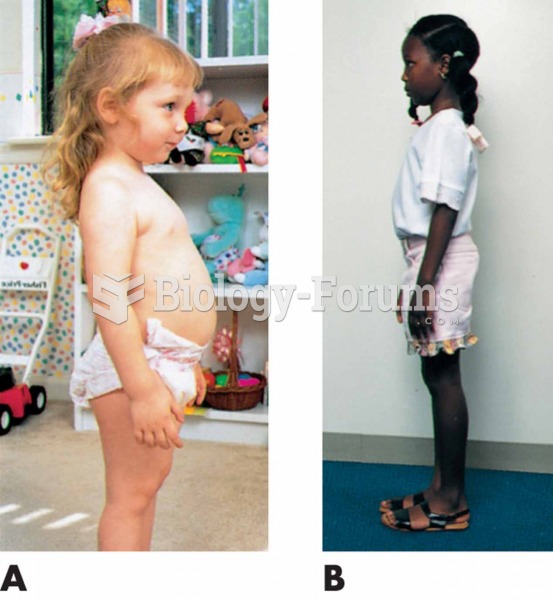 Normal development of posture and spinal curves. (A) Toddler: Protruding abdomen; lumbar lordosis. (
 A Mass-Loss Star
 This chart shows the various lines of responsibility and how they differ in presidential and parliam
 Loss of Indian Lands, 1850–2010
 Cooperative vs. noncooperative O2-binding curves
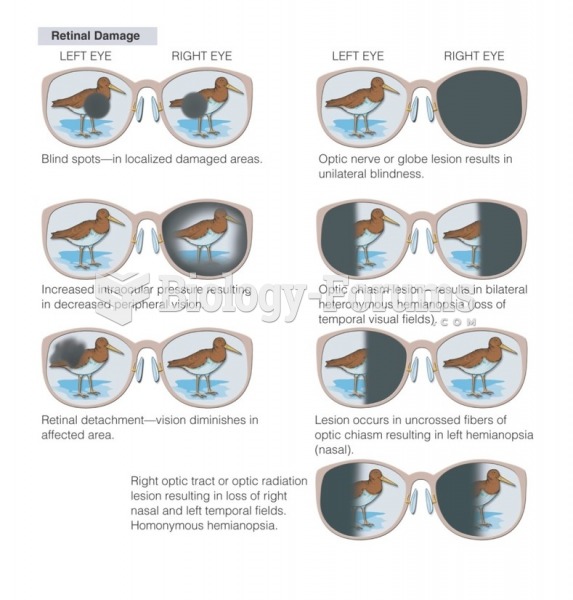 Client’s view with visual field loss