|
|
|

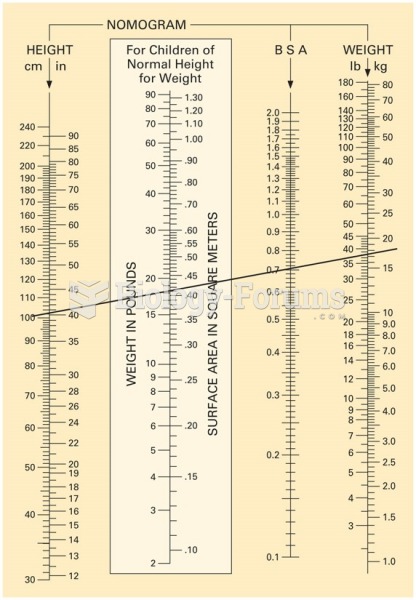 Nomogram chart. This example shows a line drawn from a child’s height of 100 cm to his weight, 35 ...
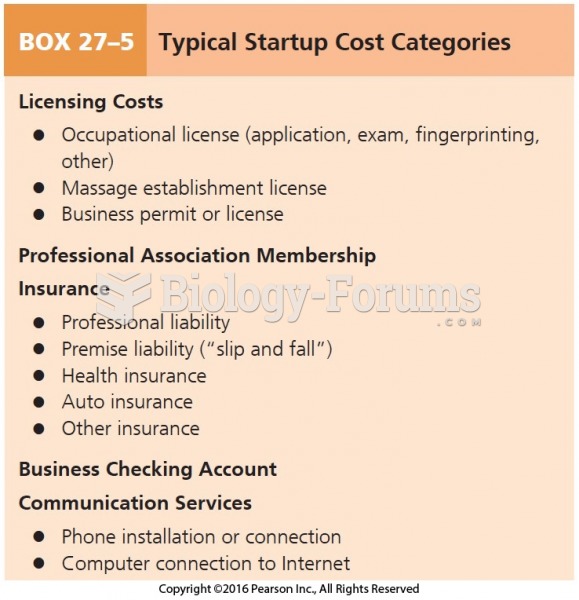 Typical Startup Cost Categories
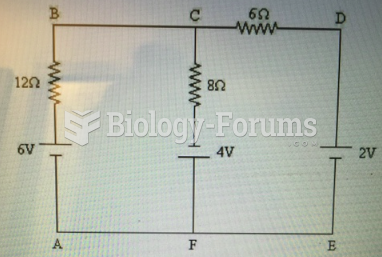 Identify the junction nodes in the circuit shown in Figure 21-1.
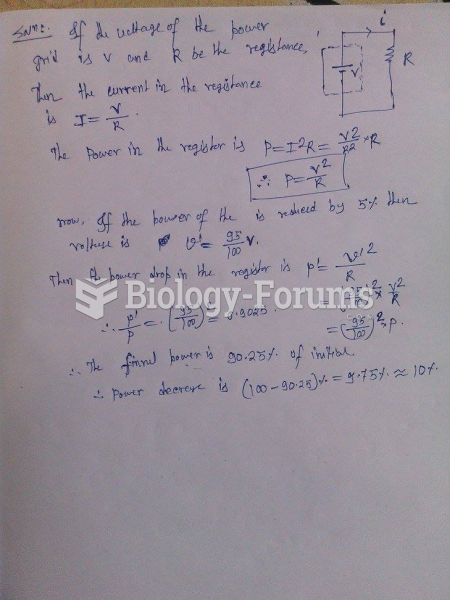 During a period of high power demand, the voltage output of the power company is reduced by ...
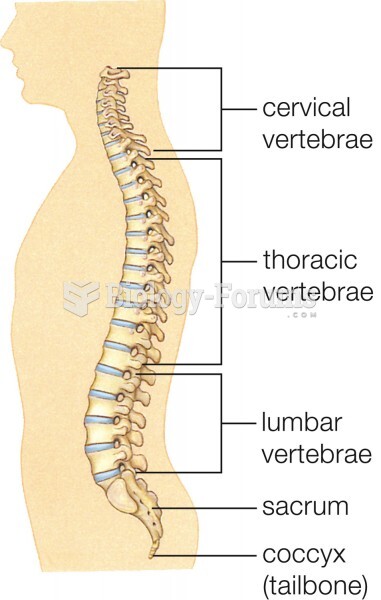 Major bone (tan) and cartilage (light blue) elements of the human skeleton. Inset shows regions of v
 Meiosis is used to make sperm and egg cells. A shows a simplified version and B shows a detailed ver