This topic contains a solution. Click here to go to the answer
|
|
|

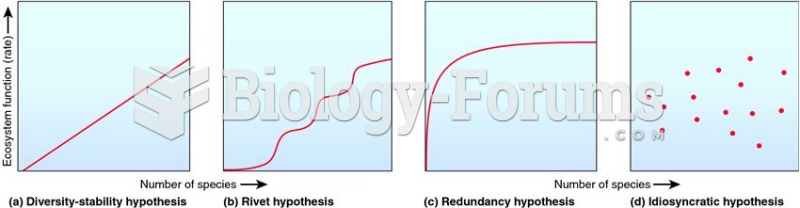 Four main models that describe the relationship between ecosystem function and biodiversity.
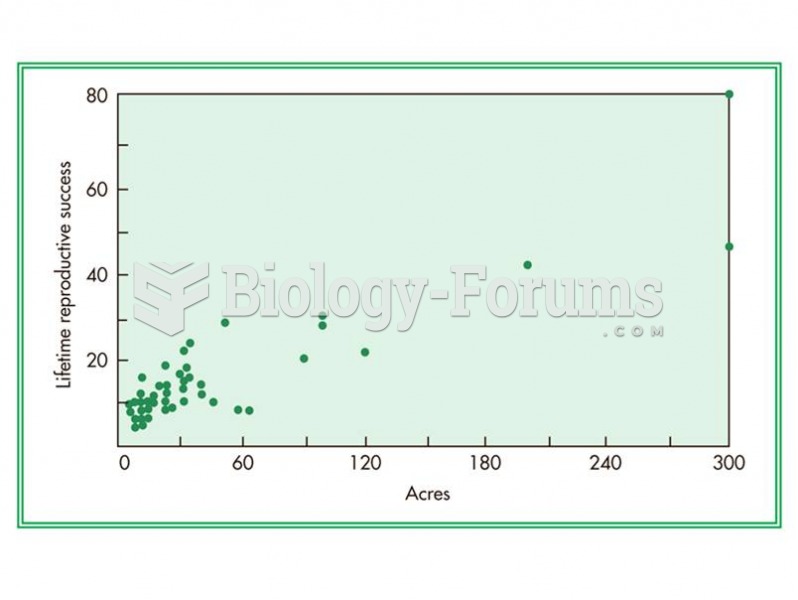 The relationship between number of acres a Kipsigis man owns and the number of offspring he has duri
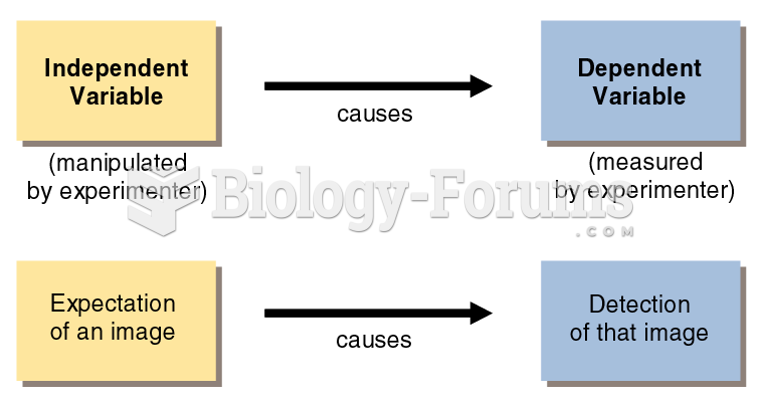 Independent and Dependent Variables
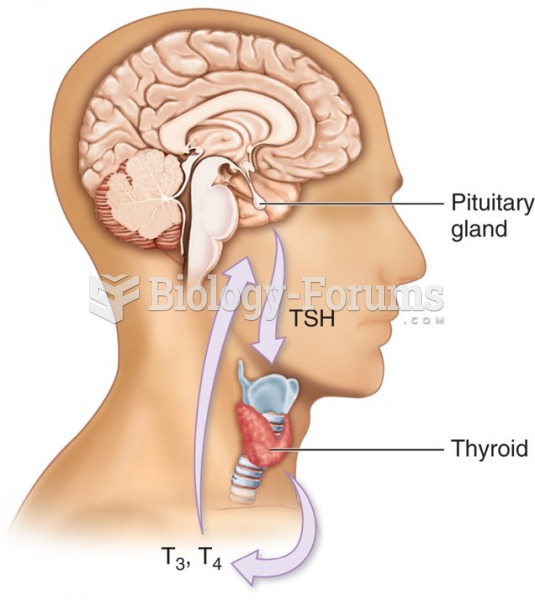 Thyroid hormone production—Relationship between pituitary and thyroid glands. Thyroid hormone ...
 Infant and Toddler Development and Responsive Program Planning: A Relationship-Based Approach
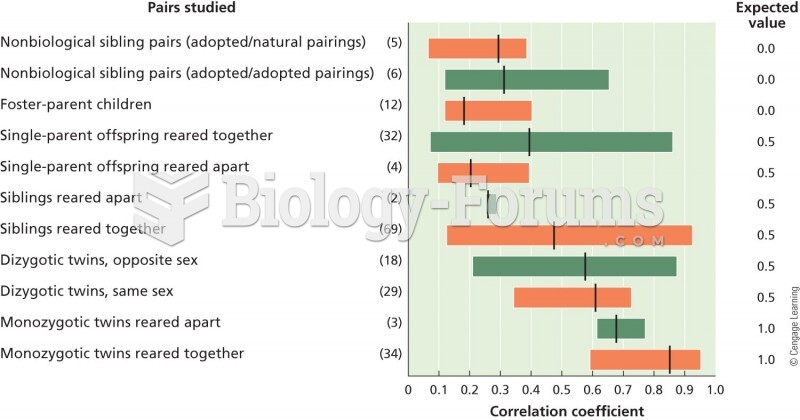 A graphical representation of correlations in IQ measurements in different sets of individuals. The