This topic contains a solution. Click here to go to the answer
|
|
|

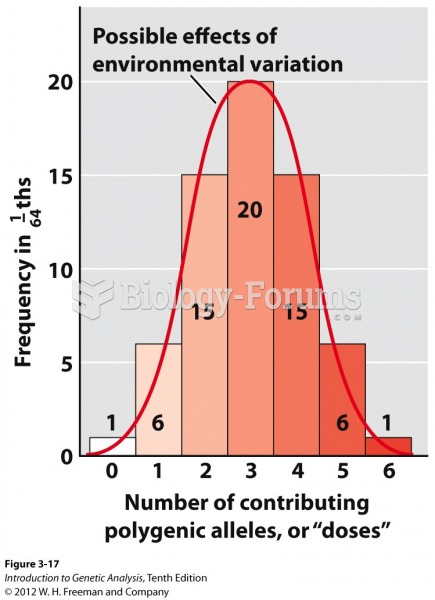 Histogram of polygenes from a trihybrid self
 Summary of US Census Data
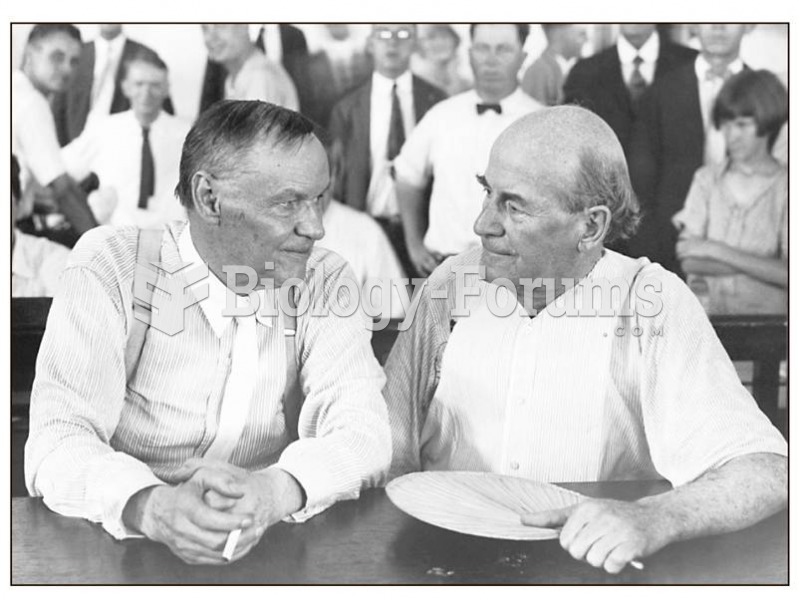 The Scopes Trial: William Jennings Bryan (right) represented the state of Tennessee, and Clarence Da
 Adding additional amounts of ethyl alcohol (ethanol) increases the frequency reading.
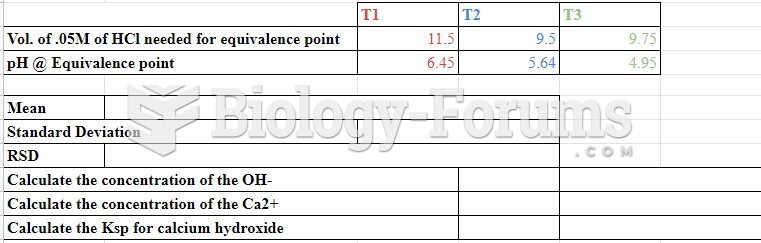 data
data
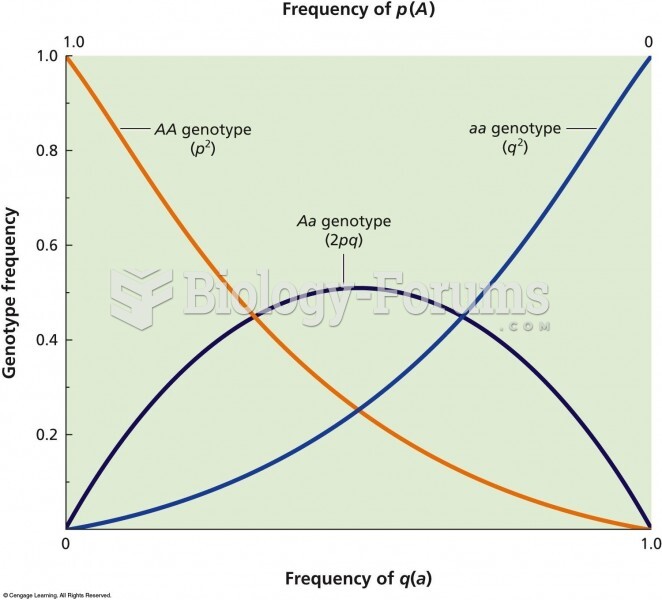 The relationship between allelic frequency and genotypic frequency in a population that is in Hardy-