|
|
|

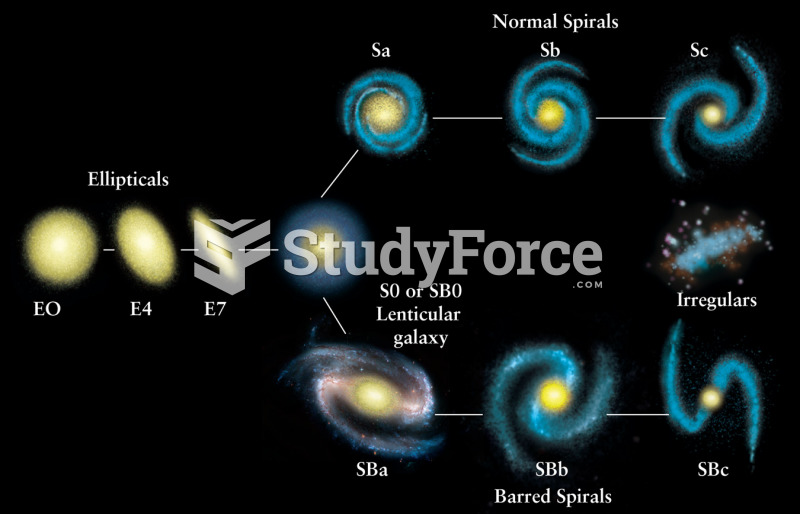 Hubble’s Tuning Fork Diagram
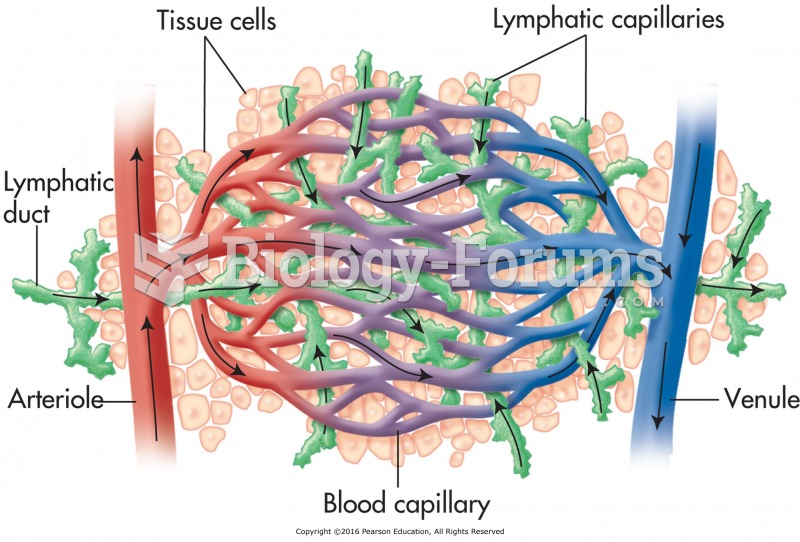 Relationship between blood and lymph capillaries.
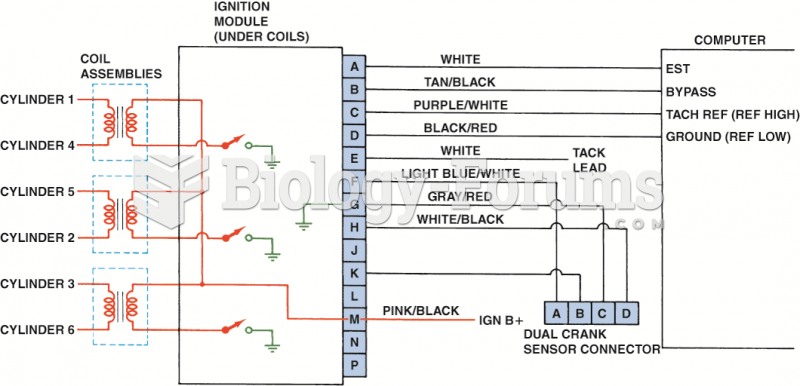 Typical wiring diagram of a V-6 distributorless (direct fire) ignition system.
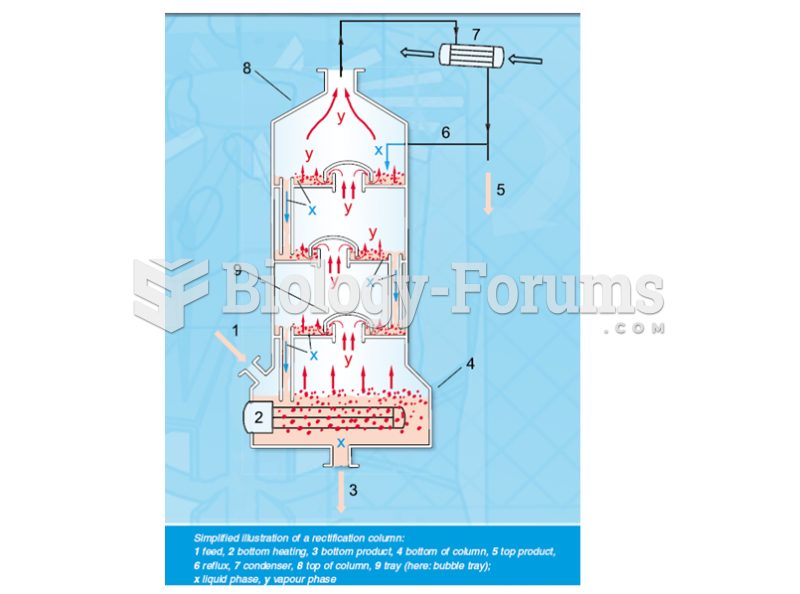 Representative Diagram of Rectification Distillation
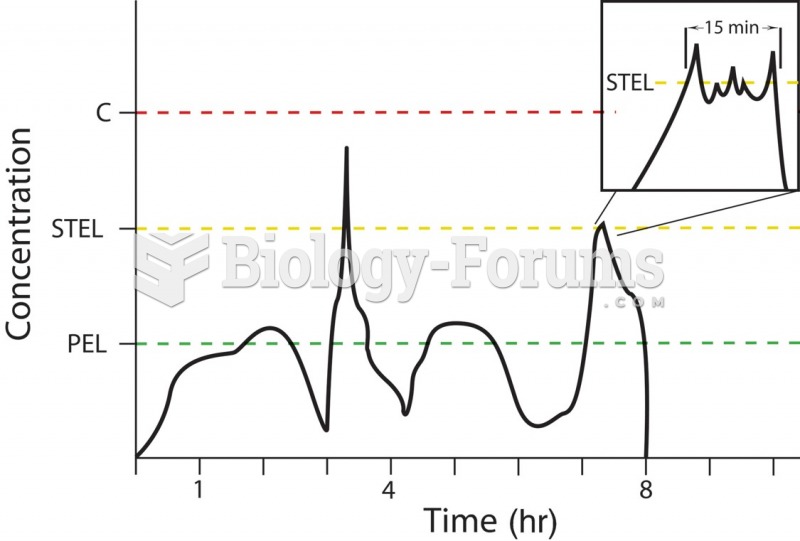 The relationship between the permissible exposure limit (PEL), the short-term exposure limit (STEL), ...
 diagram of a plant