|
|
|

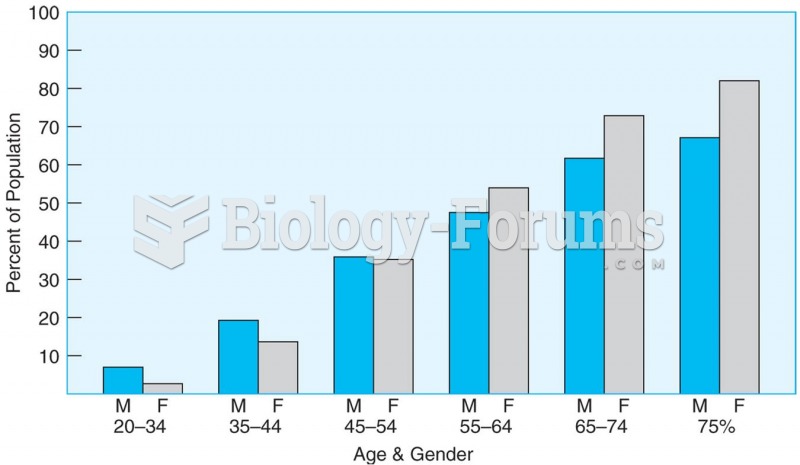 The proportion of men and women with elevated blood pressure or taking hypertension medication incre
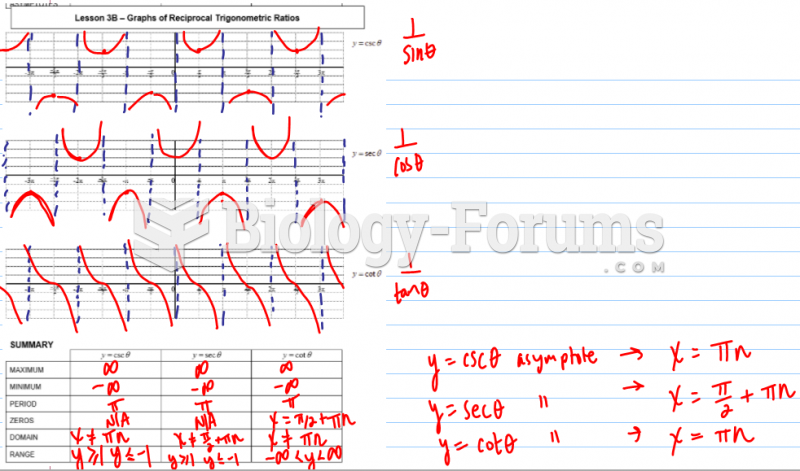 Graphs of Primary Trigonometric Ratios
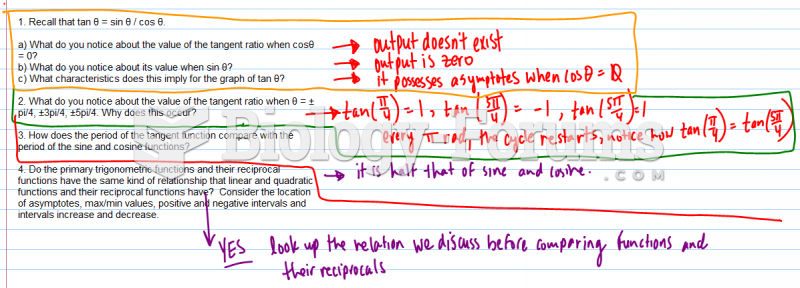 Graphs of Primary Trigonometric Ratios
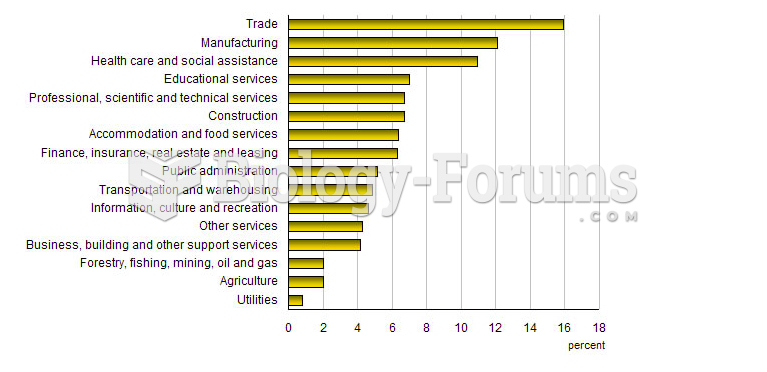 Statistics Canada, Labour Force Survey
 Statistics Question: A swim team
 Statistics Question: A swim team