|
|
|

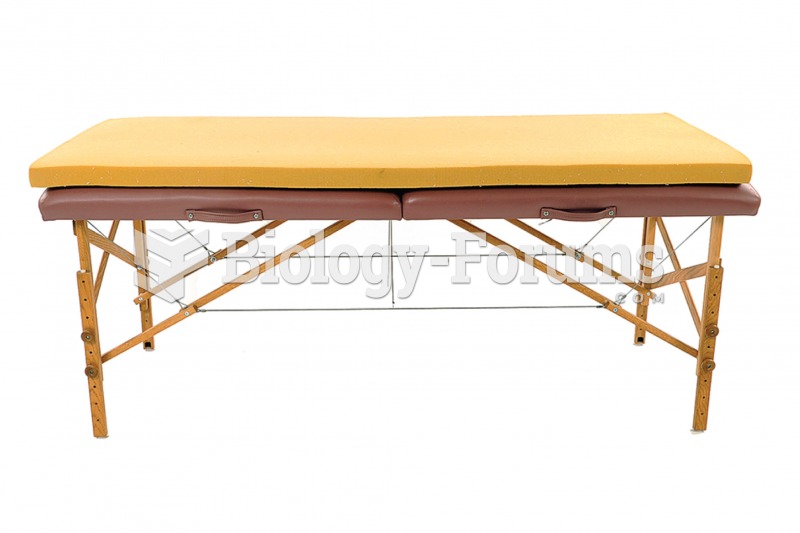 Consider using a foam pad on your table.
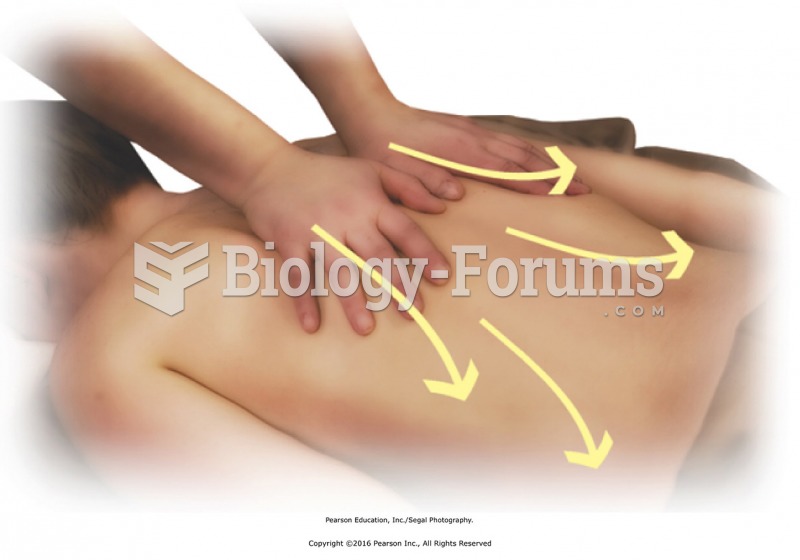 Standing at the head of the table, apply oil or lotion to the entire back with bilateral stroking. ...
 Colossal Figure of Akhenaten
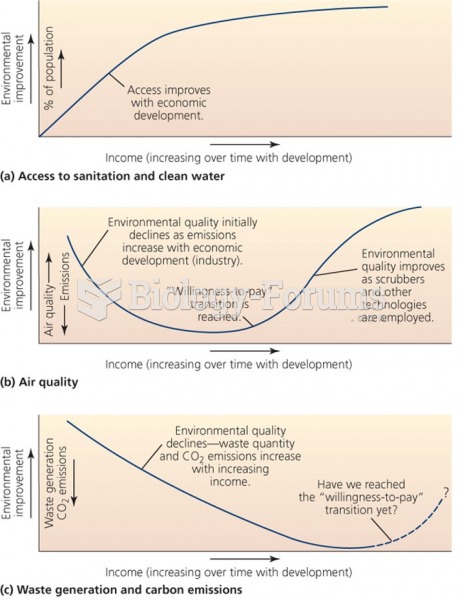 The environmental policy changes over time
 The time spent in each interval of one complete cell cycle of a human cell in culture
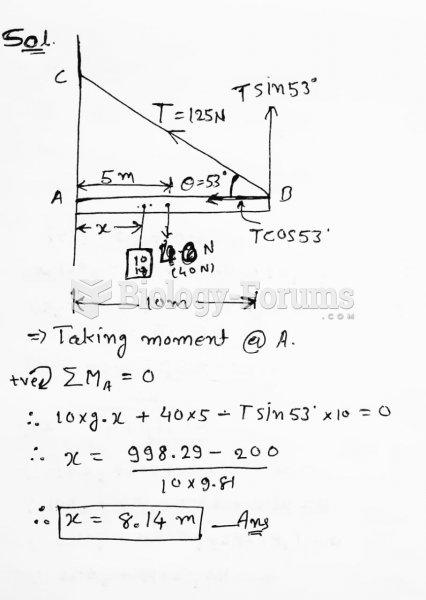 In the figure, a 10.0-m long bar is attached by a frictionless hinge to a wall and held ...