|
|
|

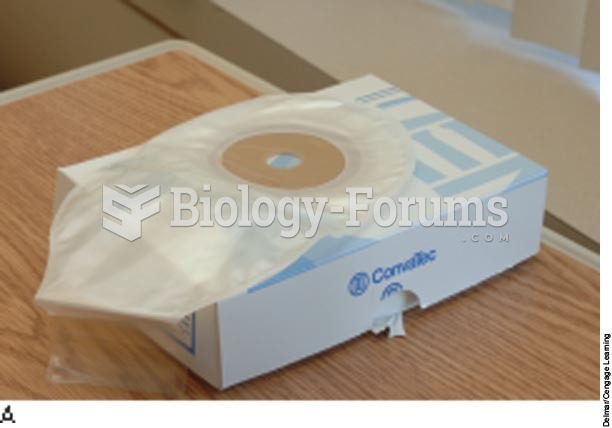 Application of an ostomy bag or pouch: A, An ostomy bag;
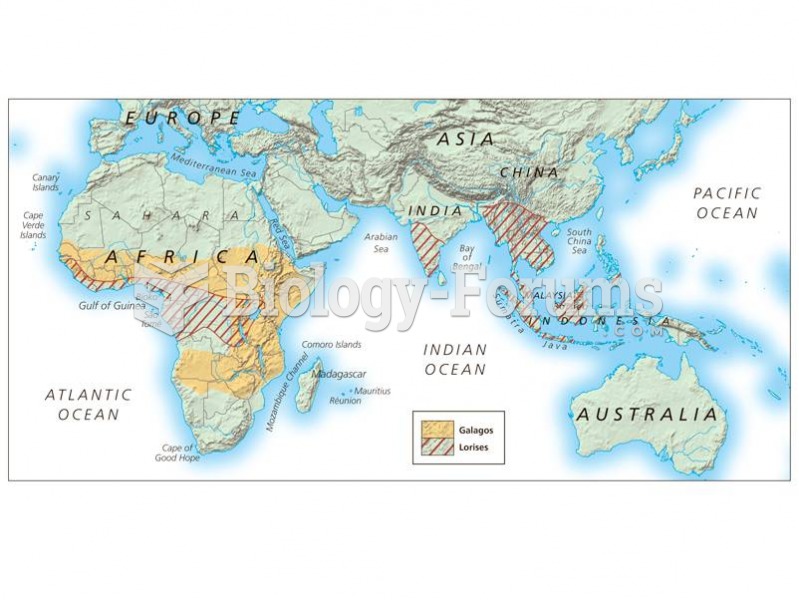 The distribution of lorsies and galagos.
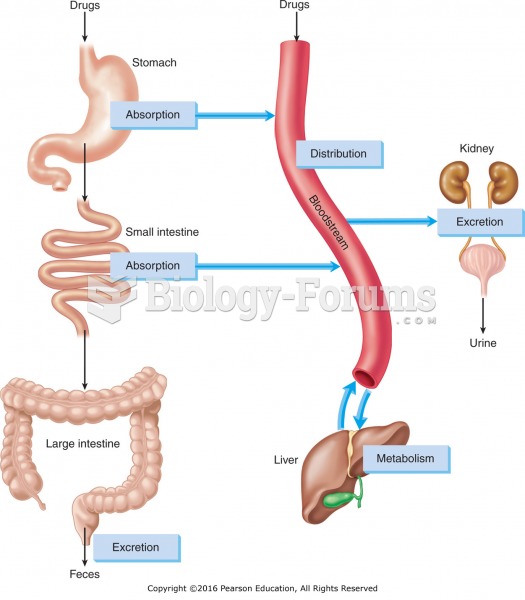 The four processes of pharmacokinetics: absorption, distribution, metabolism, and excretion.
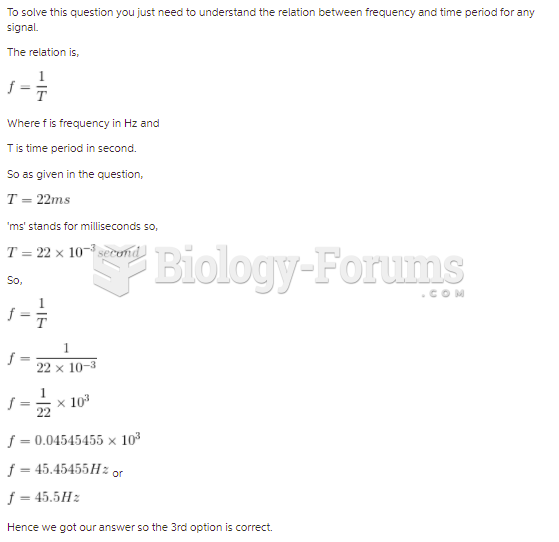 If the period of a square wave is 22 ms, what is its frequency?
 Advanced functions application
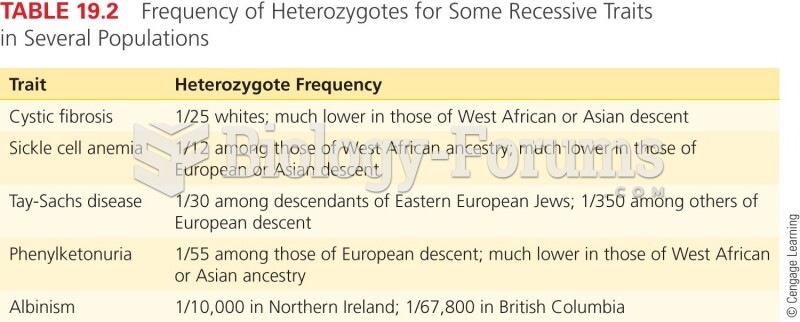 Frequency of Heterozygotes for Some Recessive Traits in Several Populations