|
|
|

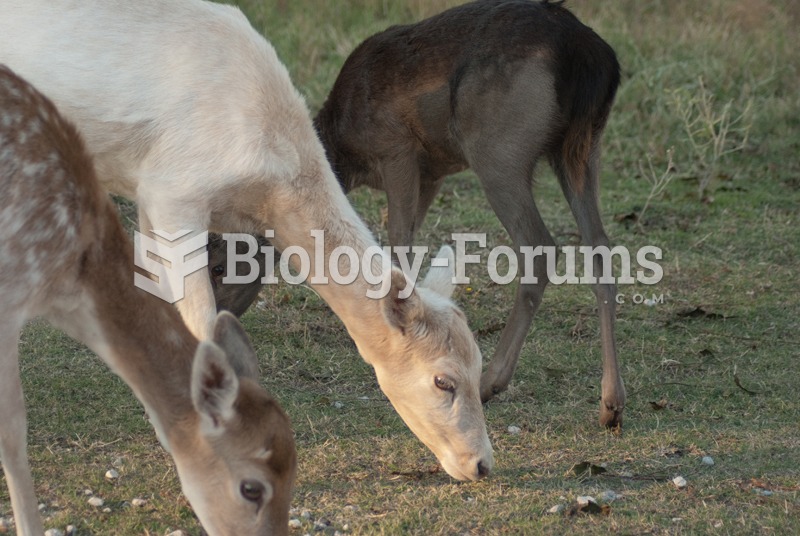 Three of the color variants found at Fossil Rim Wildlife Center in Texas
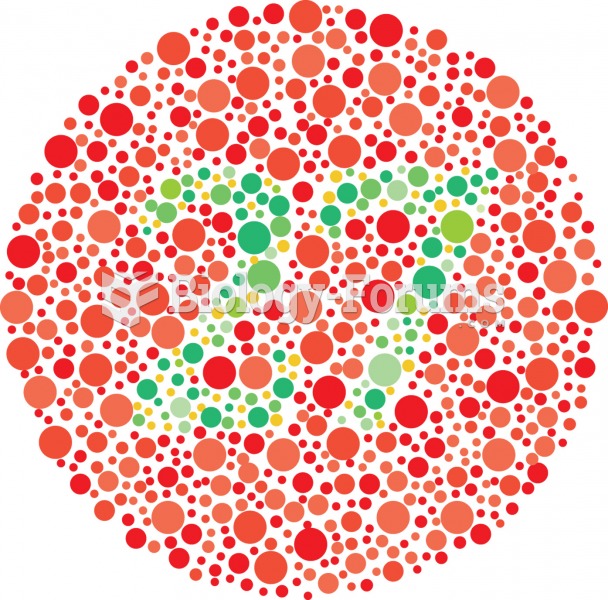 An example of color blindness test. A person with red-green color blindness would not be able to dis
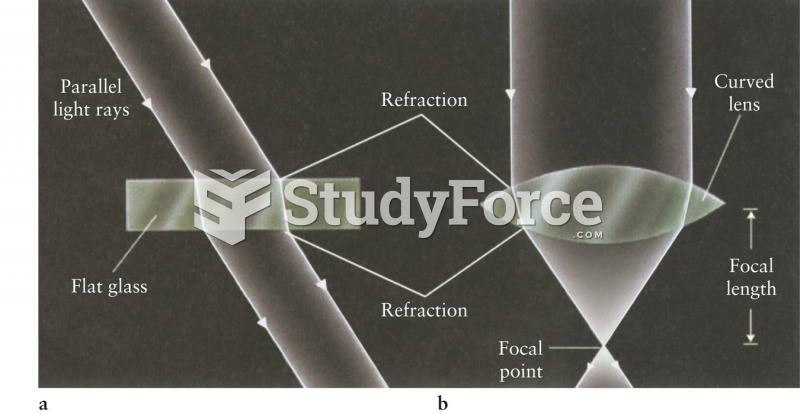 Refraction Through Uniform and Variable Thickness Glasses
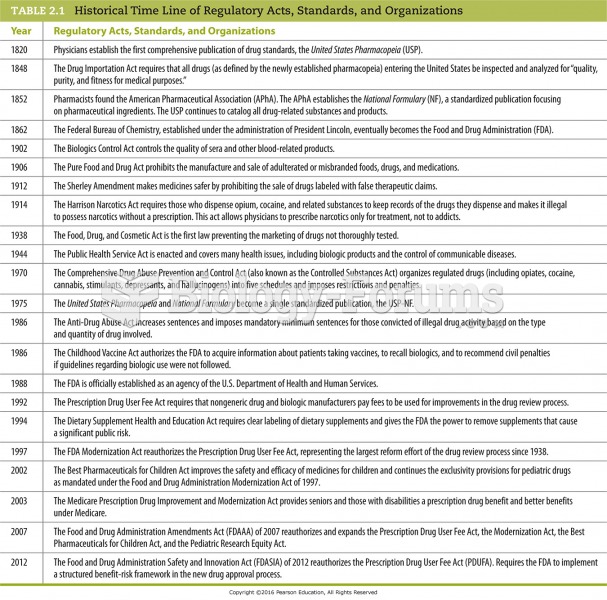 Historical Time Line of Regulatory Acts, Standards, and Organizations
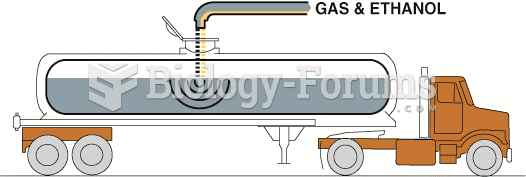 In-line blending is the most accurate method for blending ethanol with gasoline because computers ...