This topic contains a solution. Click here to go to the answer
|
|
|

 Distribution of the Income of Americans
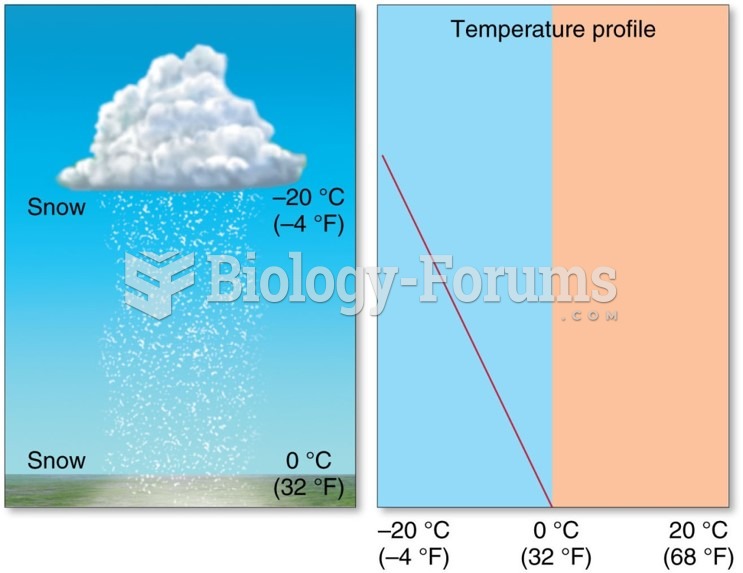 Distribution and Forms of Precipitation: Snow
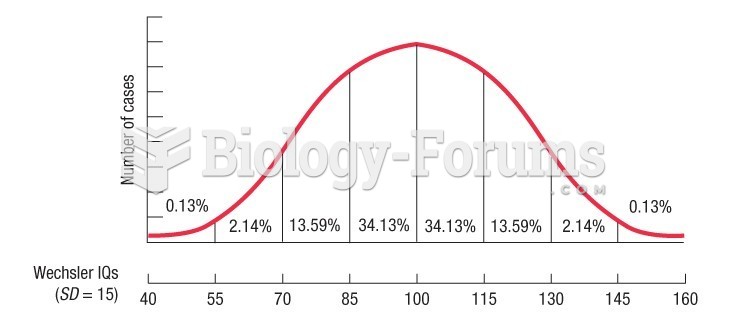 IQ scores form what mathematicians call a normal distribution "bell curve"
 Use the graph of the function f(x) to answer each question.
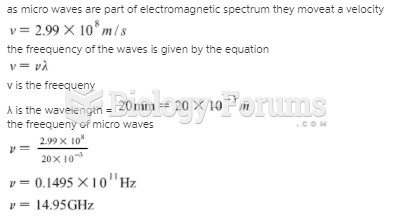 What is the frequency of 20-mm microwaves? (c = 3.0 × 10⁸ m/s) A) 100 MHzB) 400 MHzC) 15 GHzD) ...
 The frequency distribution of the allele in Africa, Southern Europe, the Middle East