|
|
|

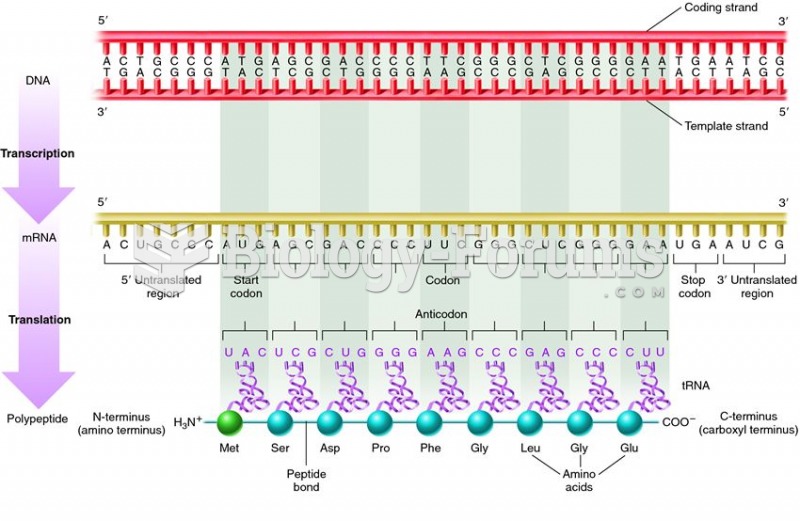 Relationships among the coding sequence of a gene, the codon sequence of an mRNA, the anticodons of
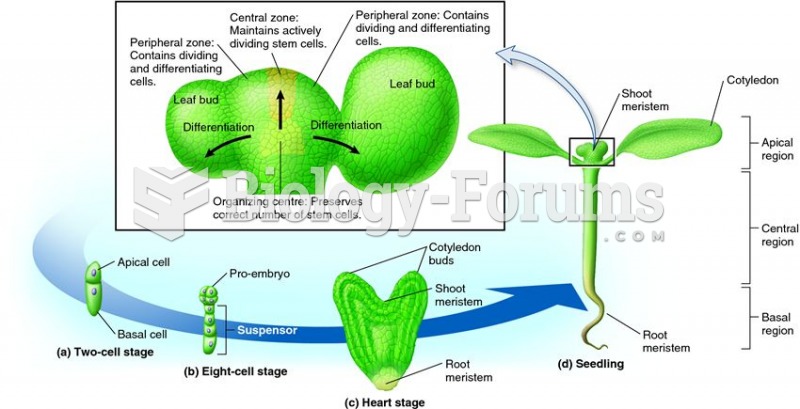 Developmental steps in the formation of a plant embryo
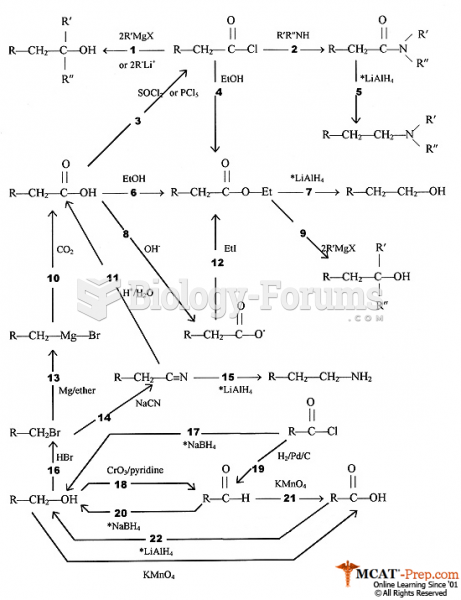 Organic Synthesis Flow Chart
 Hertzsprung-Russell diagram for a set of stars that includes the Sun
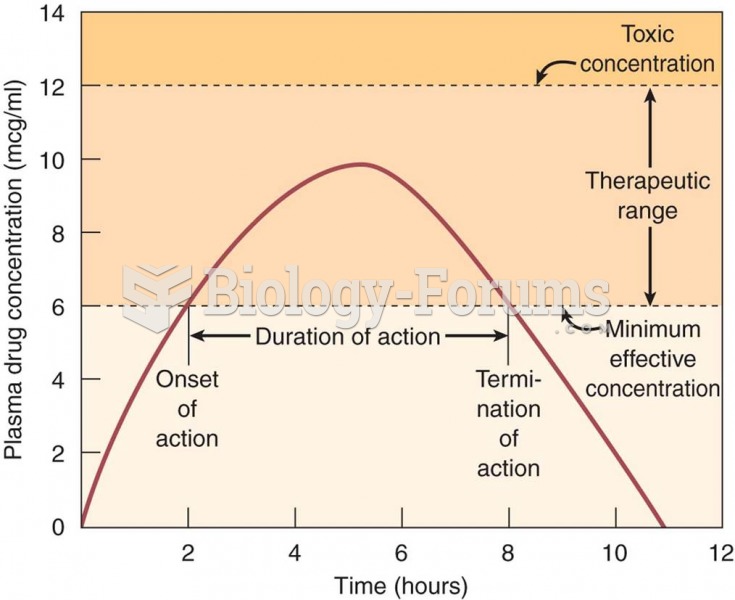 Single-dose drug administration: pharmacokinetic values for this drug are as follows: onset of actio
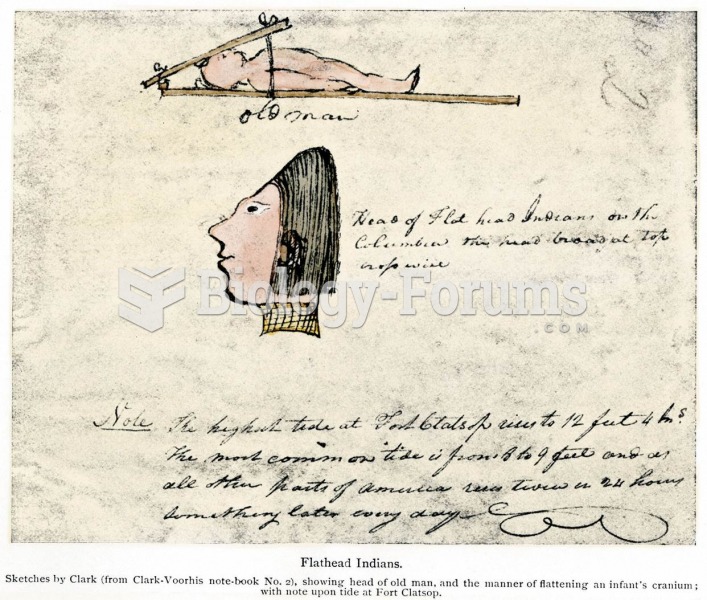 The “Flat Head” (Chinook) Indians acquired their name through shaping in infancy, as shown in a diag