Did you know?
GI conditions that will keep you out of the U.S. armed services include ulcers, varices, fistulas, esophagitis, gastritis, congenital abnormalities, inflammatory bowel disease, enteritis, colitis, proctitis, duodenal diverticula, malabsorption syndromes, hepatitis, cirrhosis, cysts, abscesses, pancreatitis, polyps, certain hemorrhoids, splenomegaly, hernias, recent abdominal surgery, GI bypass or stomach stapling, and artificial GI openings.
Did you know?
Amphetamine poisoning can cause intravascular coagulation, circulatory collapse, rhabdomyolysis, ischemic colitis, acute psychosis, hyperthermia, respiratory distress syndrome, and pericarditis.
Did you know?
Although the Roman numeral for the number 4 has always been taught to have been "IV," according to historians, the ancient Romans probably used "IIII" most of the time. This is partially backed up by the fact that early grandfather clocks displayed IIII for the number 4 instead of IV. Early clockmakers apparently thought that the IIII balanced out the VIII (used for the number 8) on the clock face and that it just looked better.

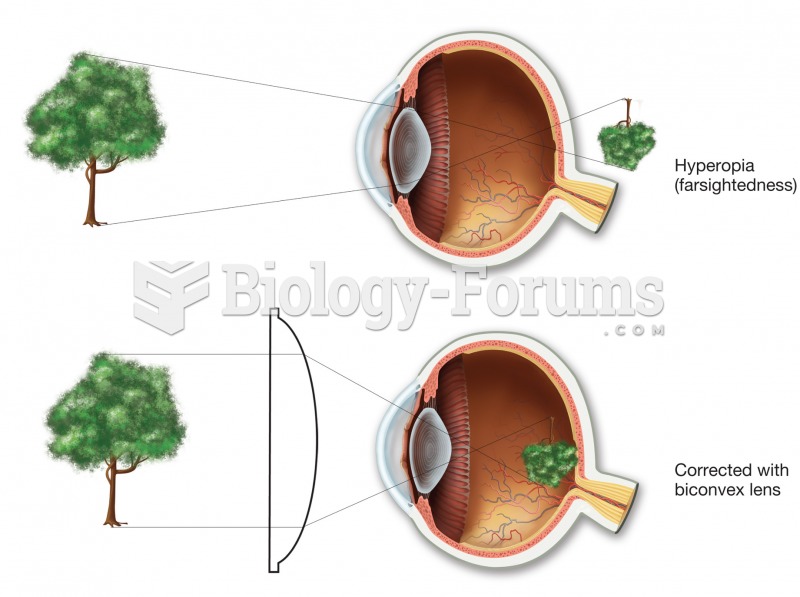 Hyperopia (farsightedness). In the uncorrected top figure, the image would come into focus behind th
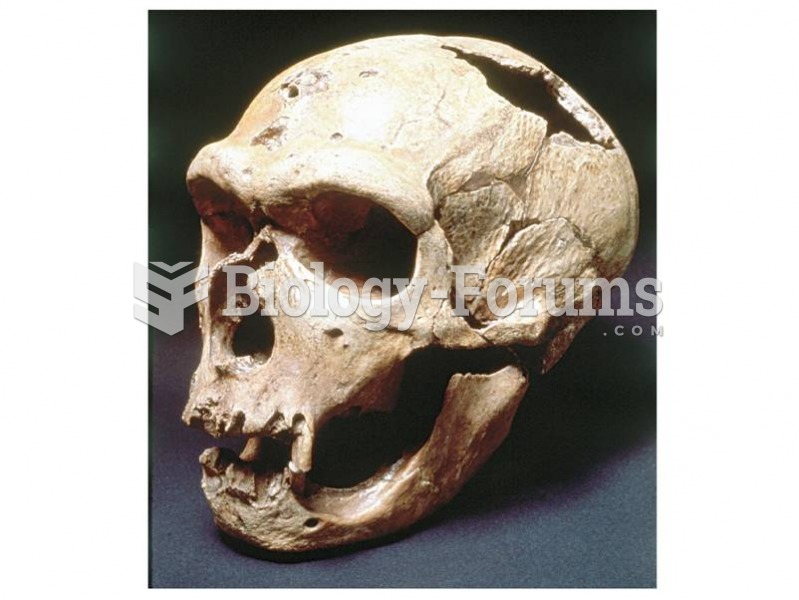 The “Old Man” from La Chapelle shows evidence of extensive tooth loss and bone resorption.
 Loss of Indian Lands, 1850–2010
 Mobilize each metatarsal–phalangeal joint with figure-8s. Hold the tarsal just below the ...
 Mobilize joints of the feet and ankle. Apply scissoring to metatarsals and figure-8s to toes. Dorsi- ...
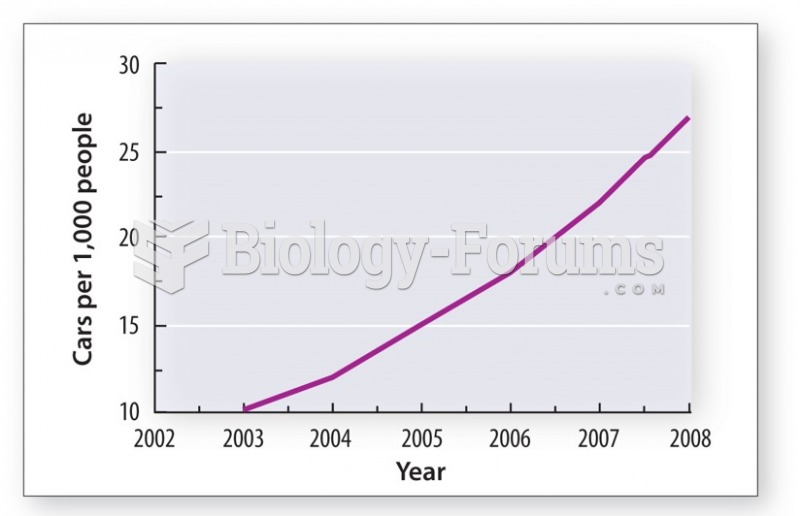 The growth in demand for oil in China is driven by the growth in demand for personal transport