This topic contains a solution. Click here to go to the answer
|
|
|

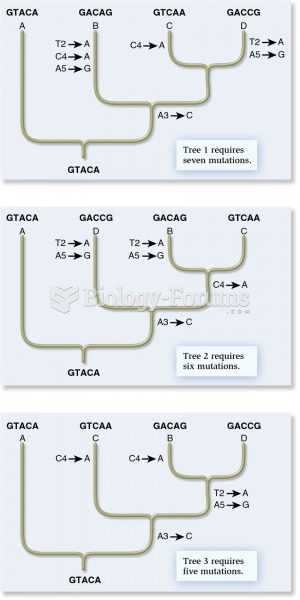 The cladistic approach from molecular genetic data
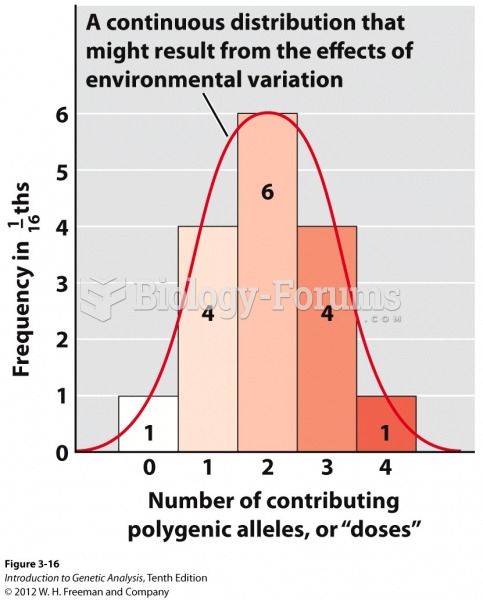 Histogram of polygenes from a dihybrid self
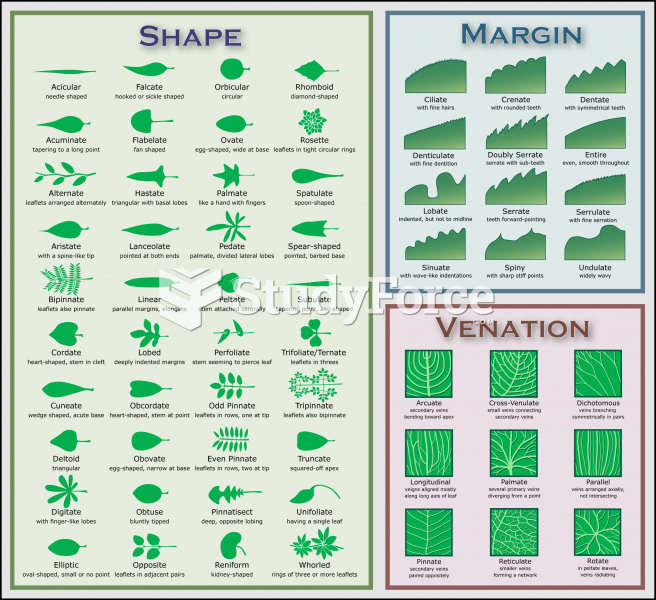 Plant Identification Chart
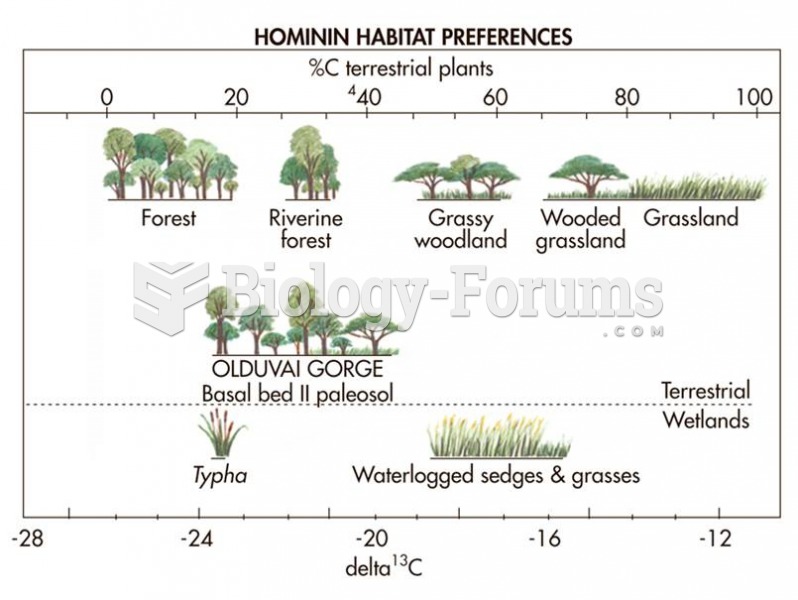 Habitat reconstruction is possible based on the kinds of plants present at past sites.
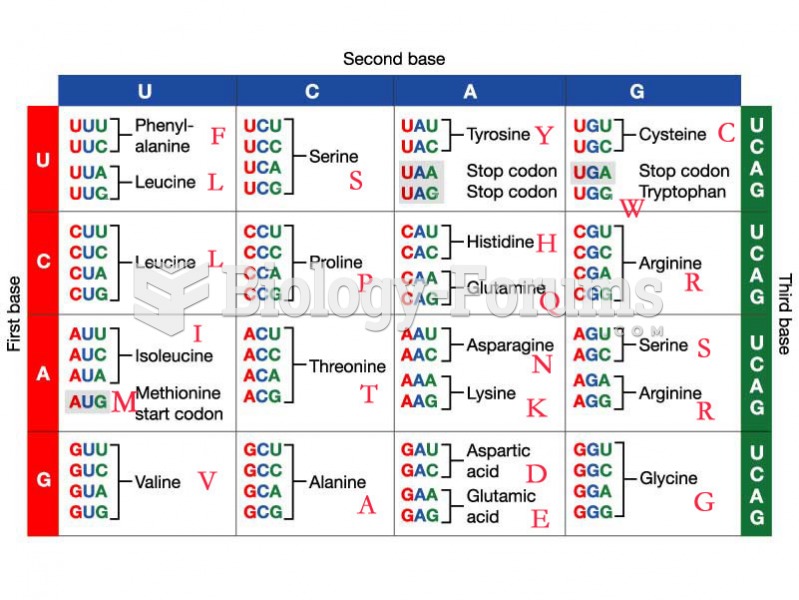 Amino acid codon chart
 How to calculate present value (Question 4)