This topic contains a solution. Click here to go to the answer
|
|
|

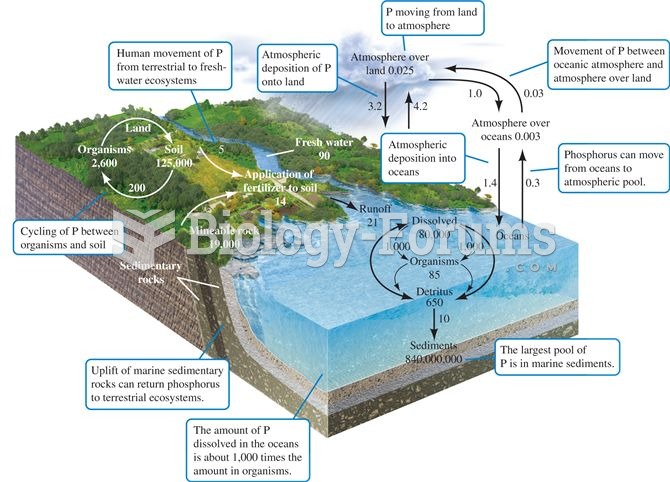 The phosphorus cycle. Numbers are 1012 g P or fluxes as 1012 g P per year (data from Schlesinger 199
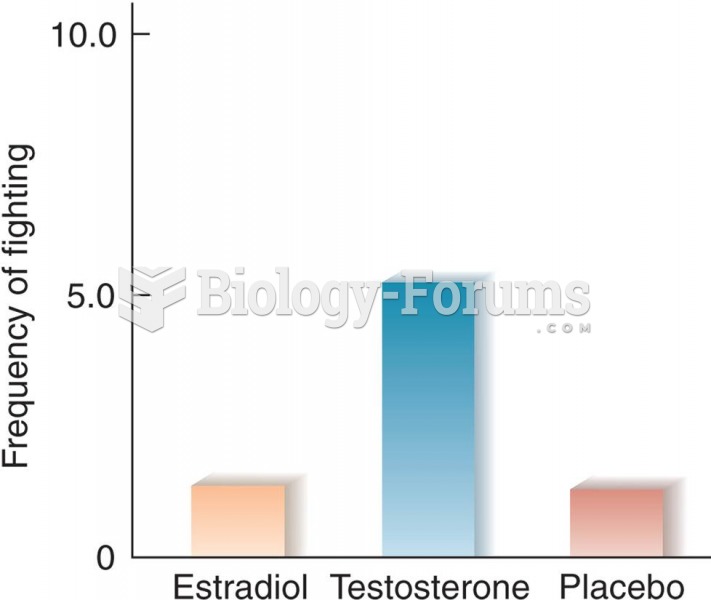 Effects of Estradiol and Testosterone on Interfemale Aggression in Rats (Based on data from van de P
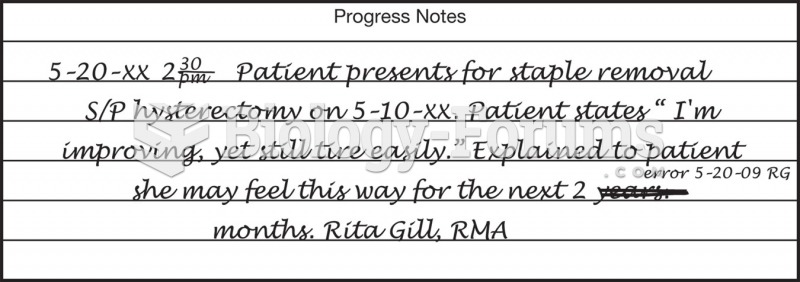 An example of a corrected chart notation.
 A typical OBD-II data link connector (DLC). The location varies with make and model and may even be ...
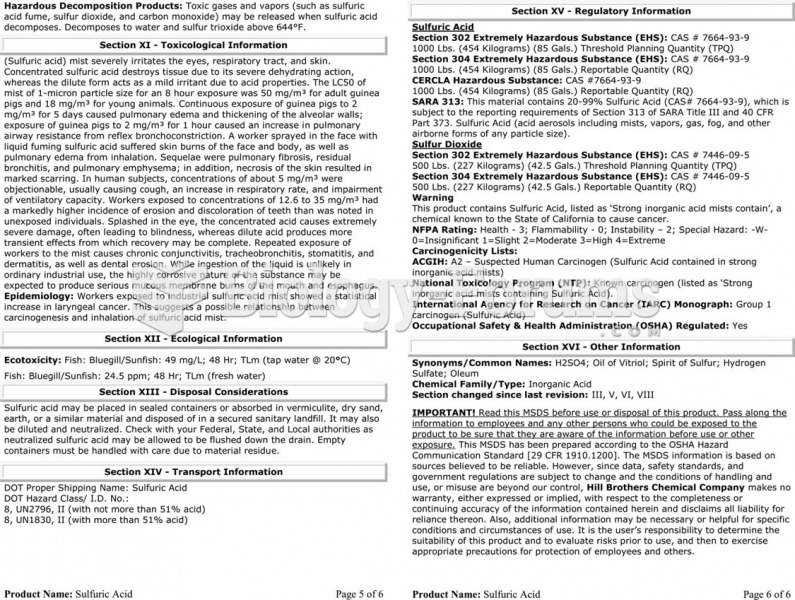 The material safety data sheet (MSDS) for sulfuric acid showing the detailed technical information ...
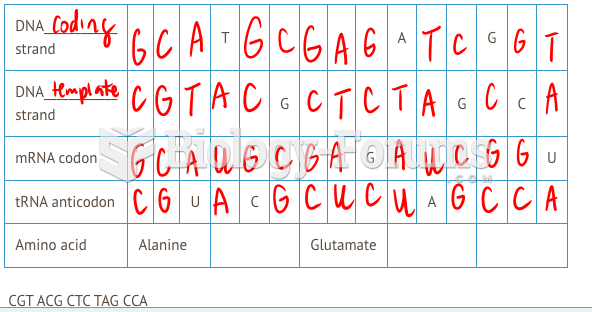 I need help fill up the chart attached phtoto long question