This topic contains a solution. Click here to go to the answer
|
|
|

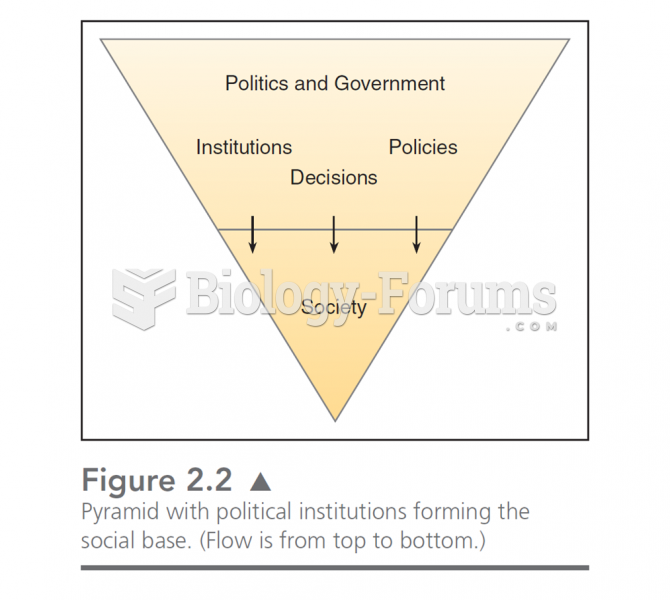 This chart illustrates the “drip down” model of government. In this, politics is formed by the soc
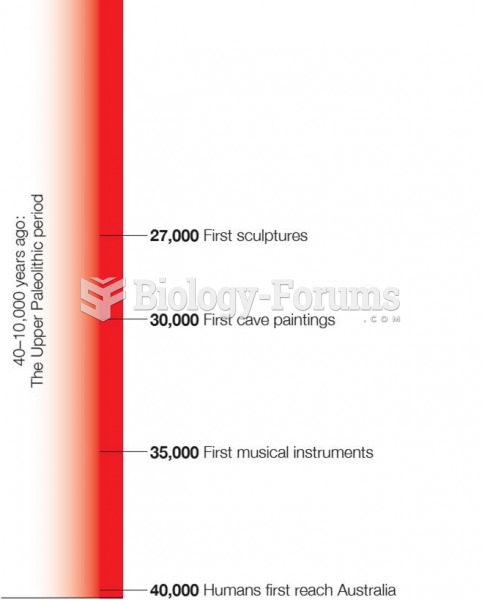 Time Line of Human History From Upper Paleolithic Period to the Present
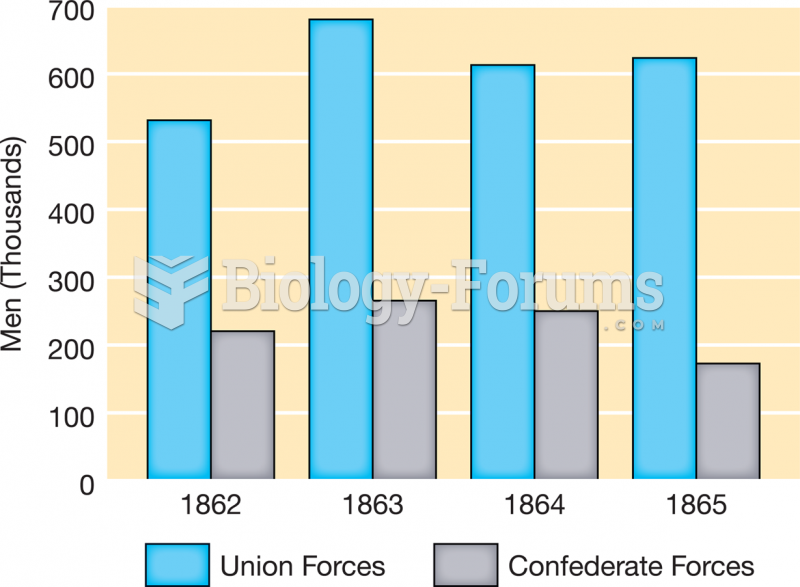 Men Present for Service during the Civil War
 An orange-red biohazard symbol indicates that bloodborne pathogens may be present, and items should ...
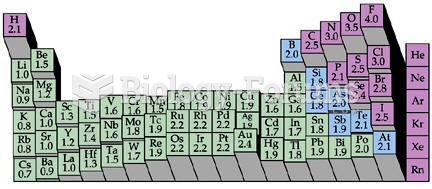 Electronegativity Chart (Periodic Table)
 How to calculate present value (Question 2)