|
|
|

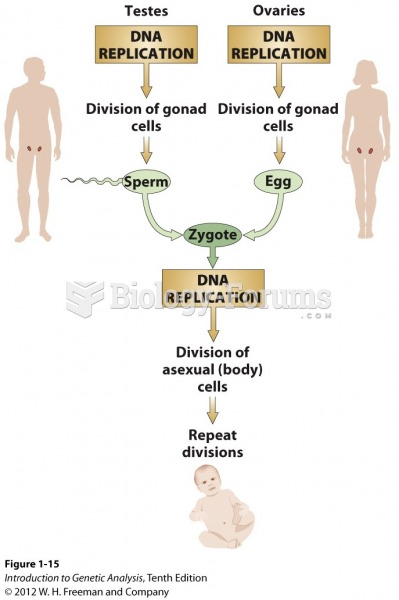 DNA replication is the basis for the perpetuation of life through time
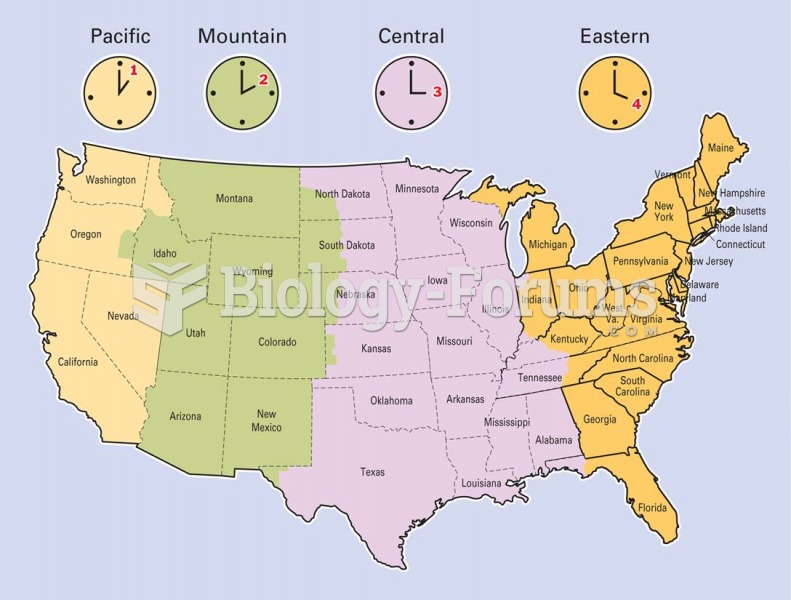 Having a time zone map located near the telephone will assist you when making long distance calls ou
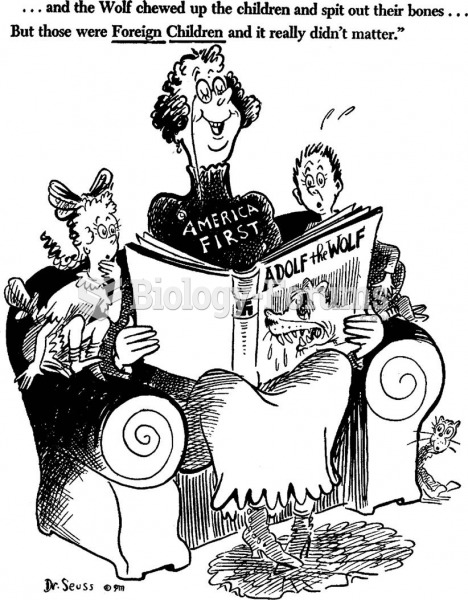 For a time Dr. Seuss—Theodor Seuss Geisel—drew political cartoons. This one, published in ...
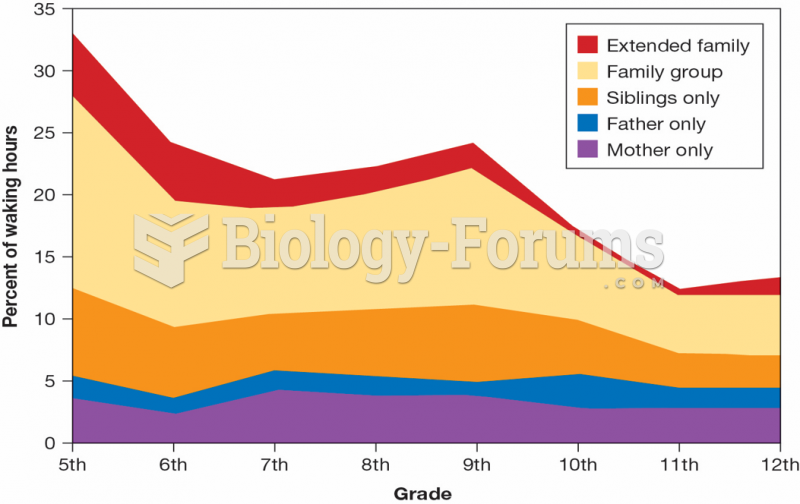 Changes in Time Spent with Family Members
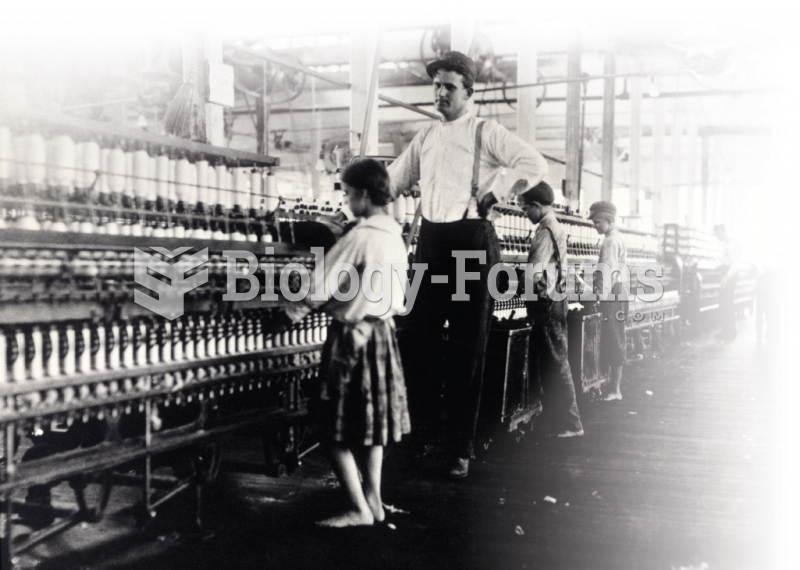 In early capitalism, children worked alongside adults. At that time, just as today, most street ...
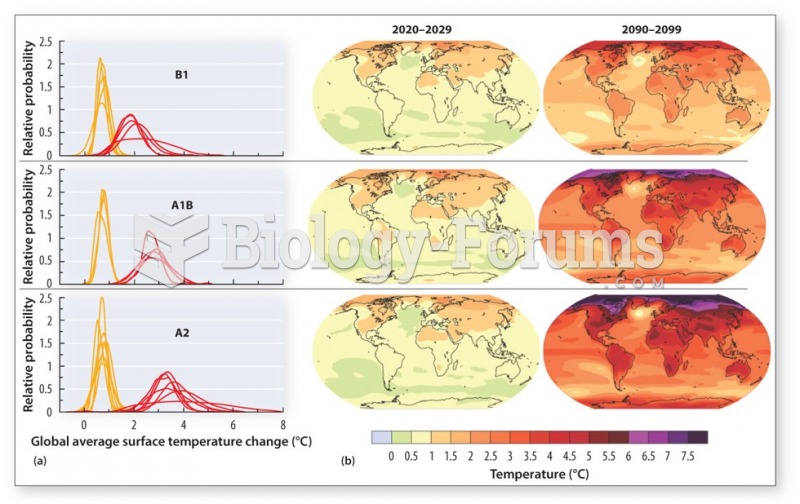 The Global Impact of Climate Change