|
|
|

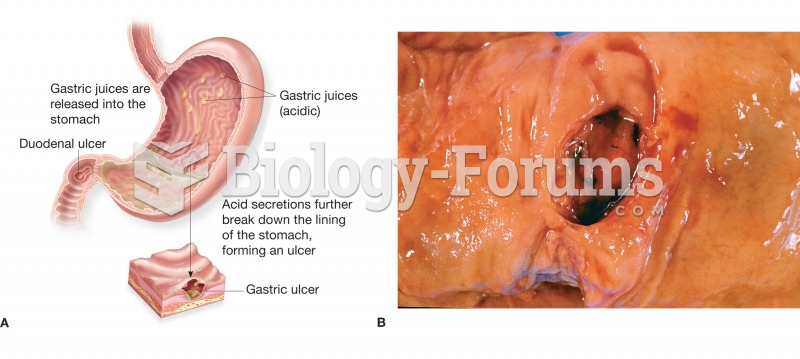 (A) Figure illustrating the location and appearance of a peptic ulcer in both the stomach and the du
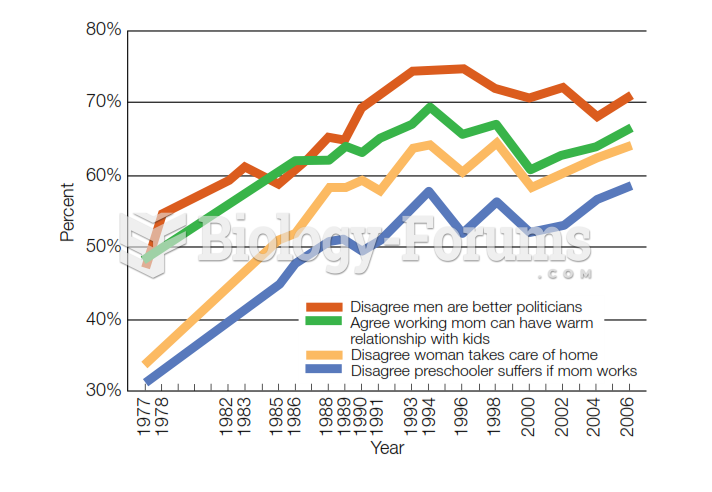 Change in American Gender Attitudes, 1977-2006 Over recent decades, views of gender roles have beco
 Under what conditions can part-time employment in high school be a negative influence on school ...
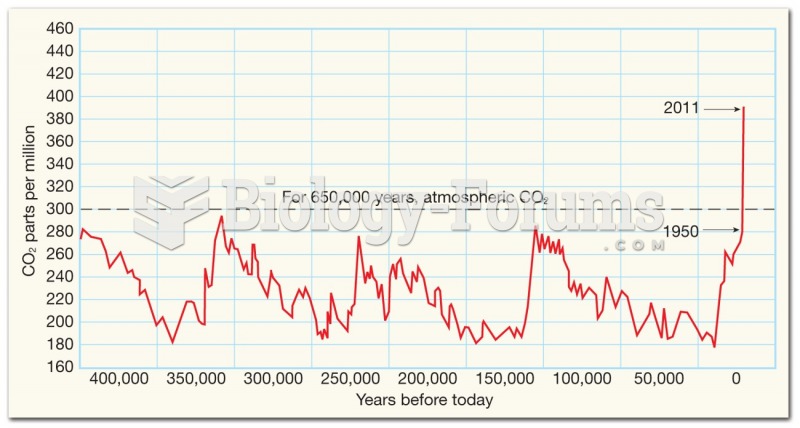 Carbon Dioxide, Trace Gases, and Climate Change
 An artist’s depiction illustrating the orientation of the base
 Incomplete dominance in flowering time of pea plants