|
|
|

 DNA replication is the basis for the perpetuation of life through time
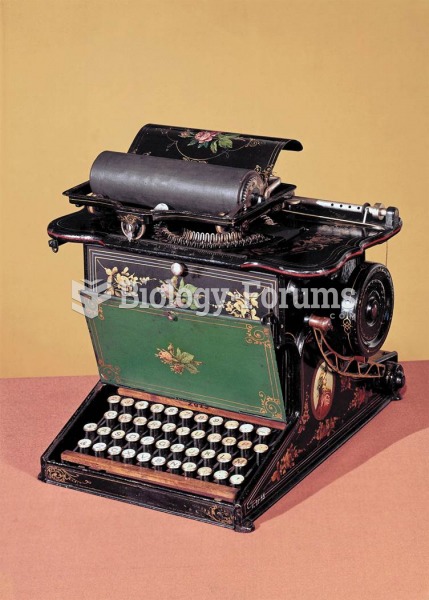 The first commercially successful typewriter, manufactured in quantity beginning in 1874, surely fue
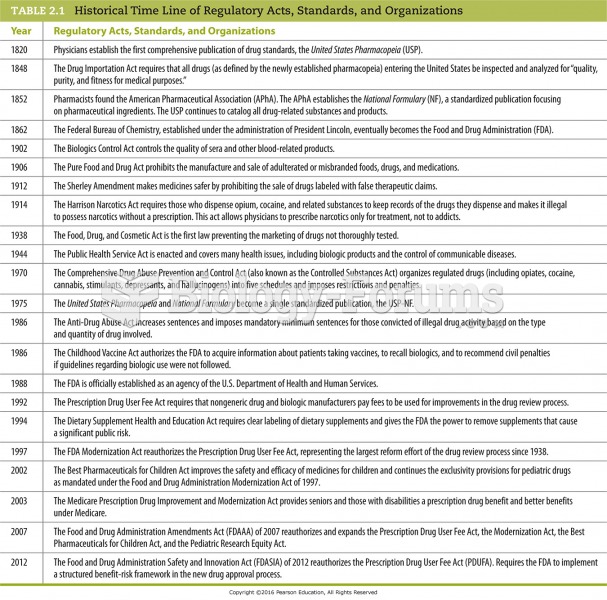 Historical Time Line of Regulatory Acts, Standards, and Organizations
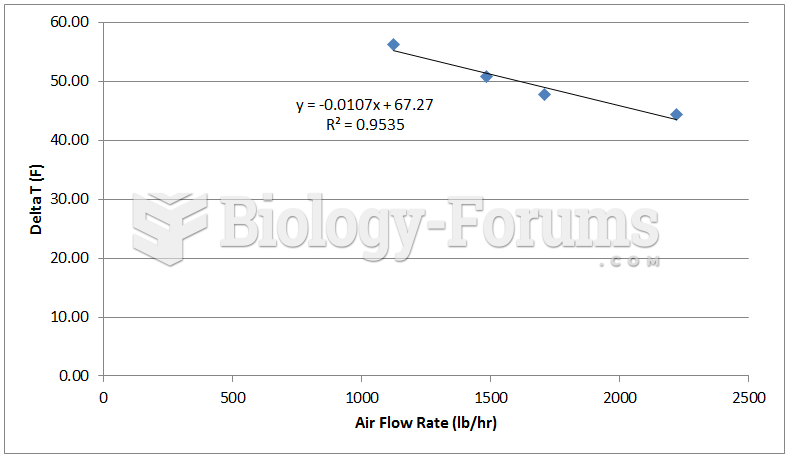 Change in air temperature at various air flow rates for a 4 pass operation
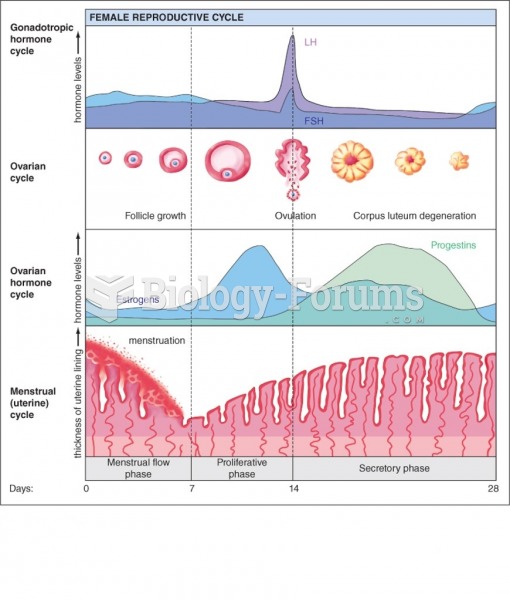 Hormonal change during ovulation and urinear cycles
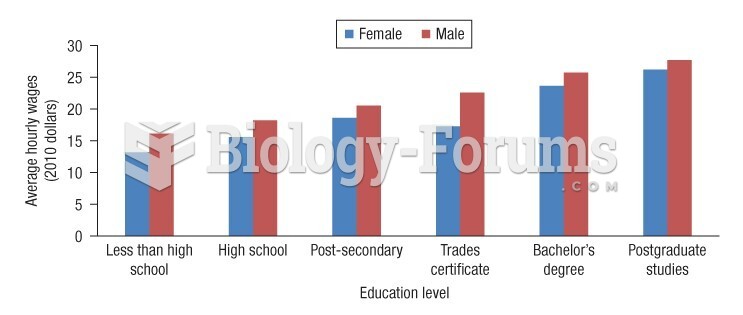 Average real hourly wages (2010 dollars) by education level, full-time workers aged 17 to 34 in 2011