|
|
|

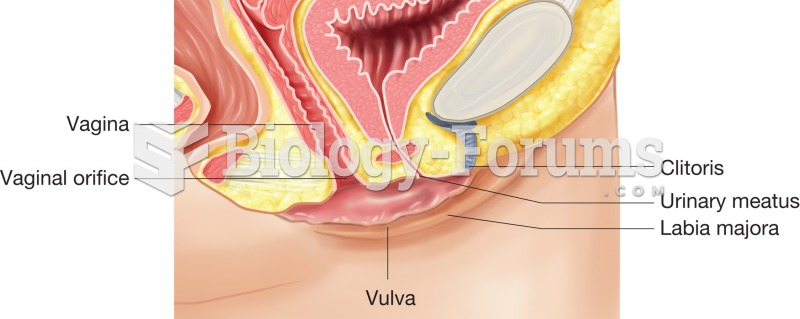 The vulva, sagittal section illustrating how the labia majora and labia minora cover and protect the
 Remedies for insomnia include increased physical exercise and time spent outdoors.
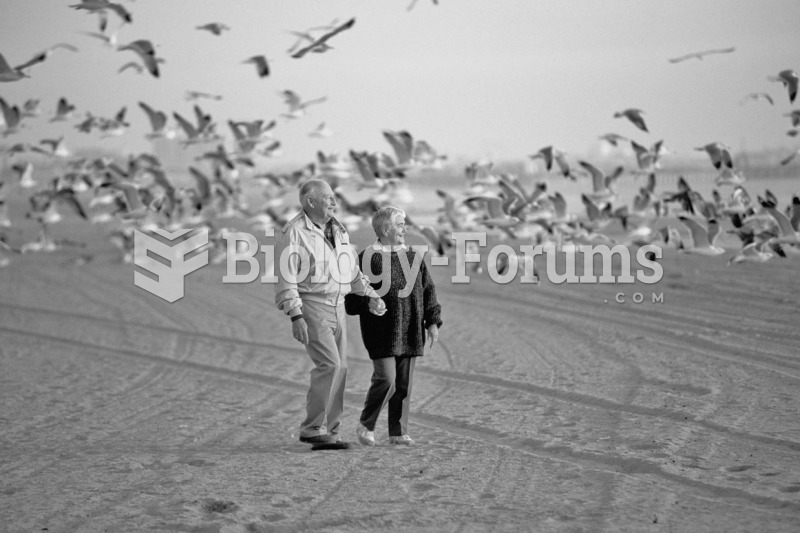 Older adulthood can be a time of independence and exploration as responsibilities diminish and the ...
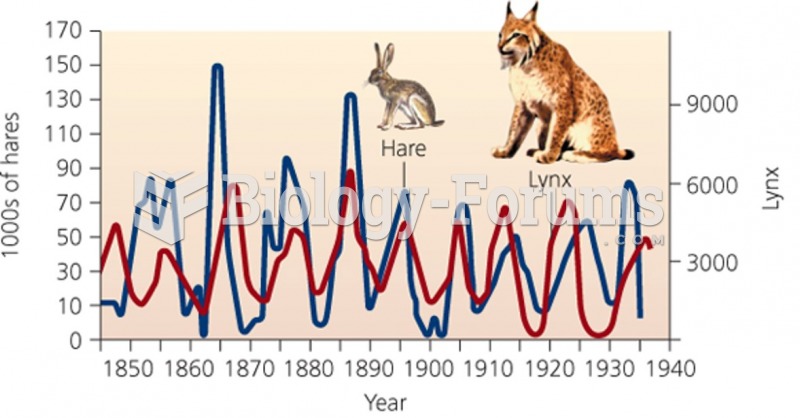 Hares and Lynx population change "الأرانب البرية و الوشق"
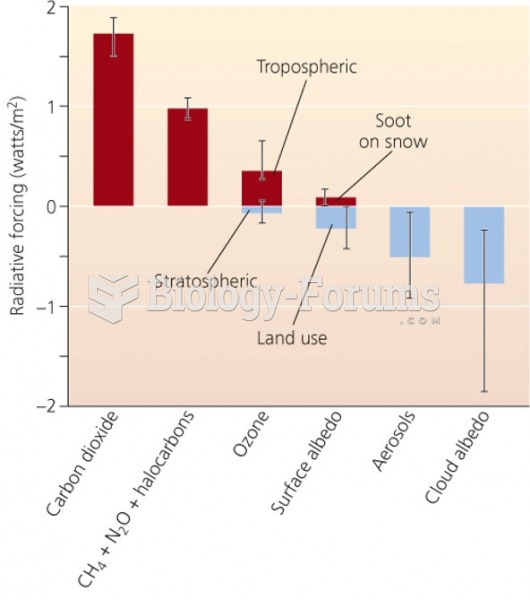 Radiative forcing expresses change in energy input over time
 For each function f(x) = 6x^2 - 4, estimate the instantaneous rate of change for the given ...