This topic contains a solution. Click here to go to the answer
|
|
|

 The Tsavo Man-Eaters on display in the Field Museum of Natural History in Chicago, Illinois.
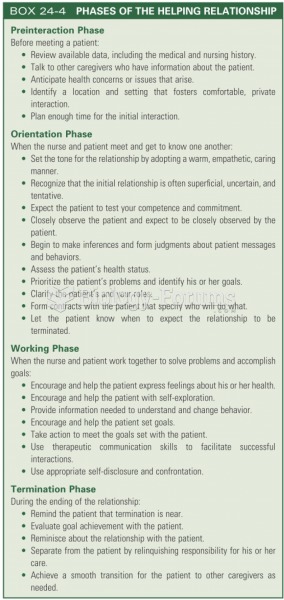 Phases of the working relationship
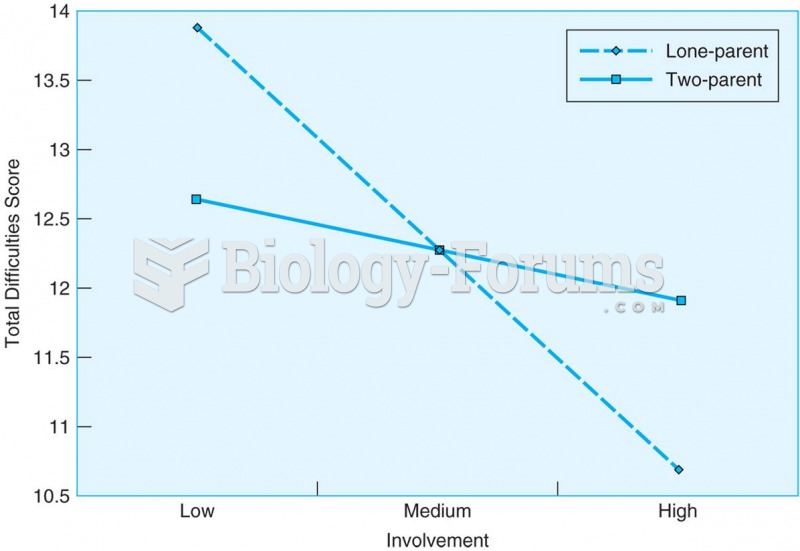 When teenagers live in single-parent homes, a good relationship with grandparents is related to ...
 Relationship between thymidylate synthase and enzymes of tetrahydrofolate metabolism
 Infant and Toddler Development and Responsive Program Planning: A Relationship-Based Approach
 How to analyse a pathological stage plot?