|
|
|

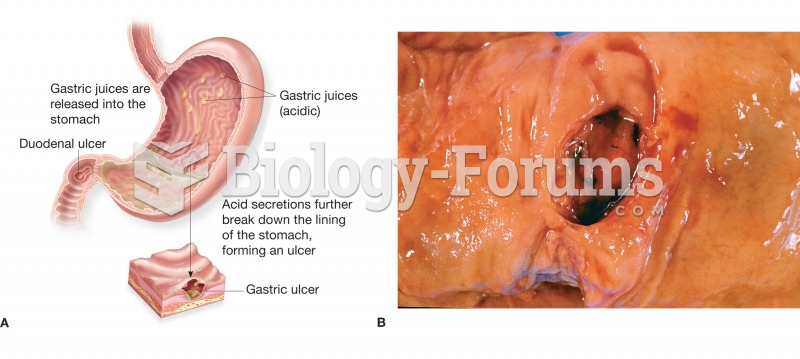 (A) Figure illustrating the location and appearance of a peptic ulcer in both the stomach and the du
 Marx's Model of Historical Change
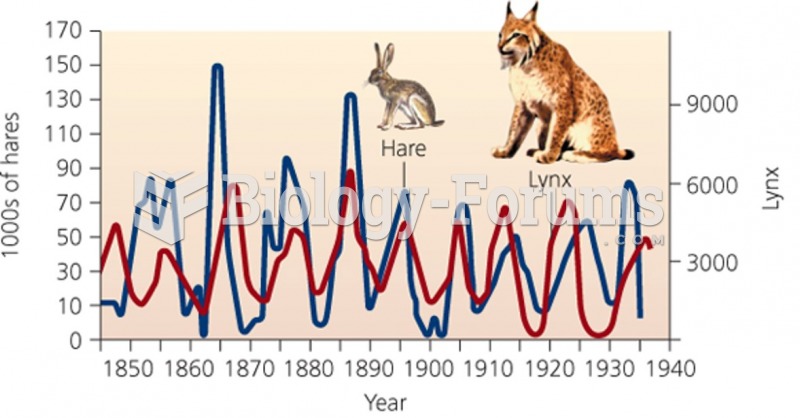 Hares and Lynx population change "الأرانب البرية و الوشق"
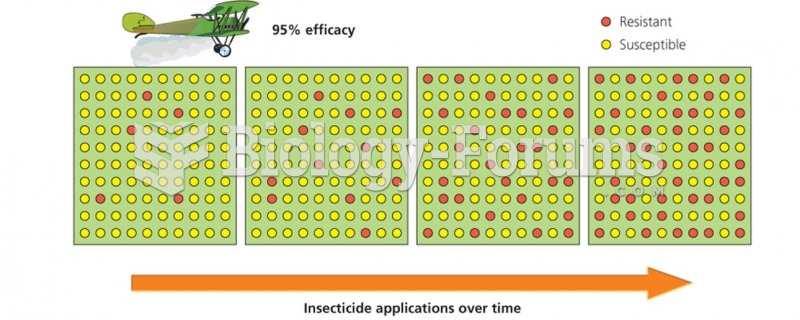 Insecticide application over time
 Time-of-entry mapping